
Version check: These steps apply to the workflow described below. Verify your script version and the latest TradingView/provider interface before relying on an old preset, extension or automation alert.
🔥 How to use TradingTools.Software (Tradingview Optimizer)
Tip
This tool is a Google Chrome extension, so it won’t work with other browsers!
How to add it to Tradingview
Step 1
Open TradingTools.Software webpage.
Tip
You can try the tool for free, using the “Download Free” button, this is a trial version, if you find the tool useful, you can “Buy Licenese” to unleash it’s full power.
For this guide I will use the Free Version, click the “Download Free” button.
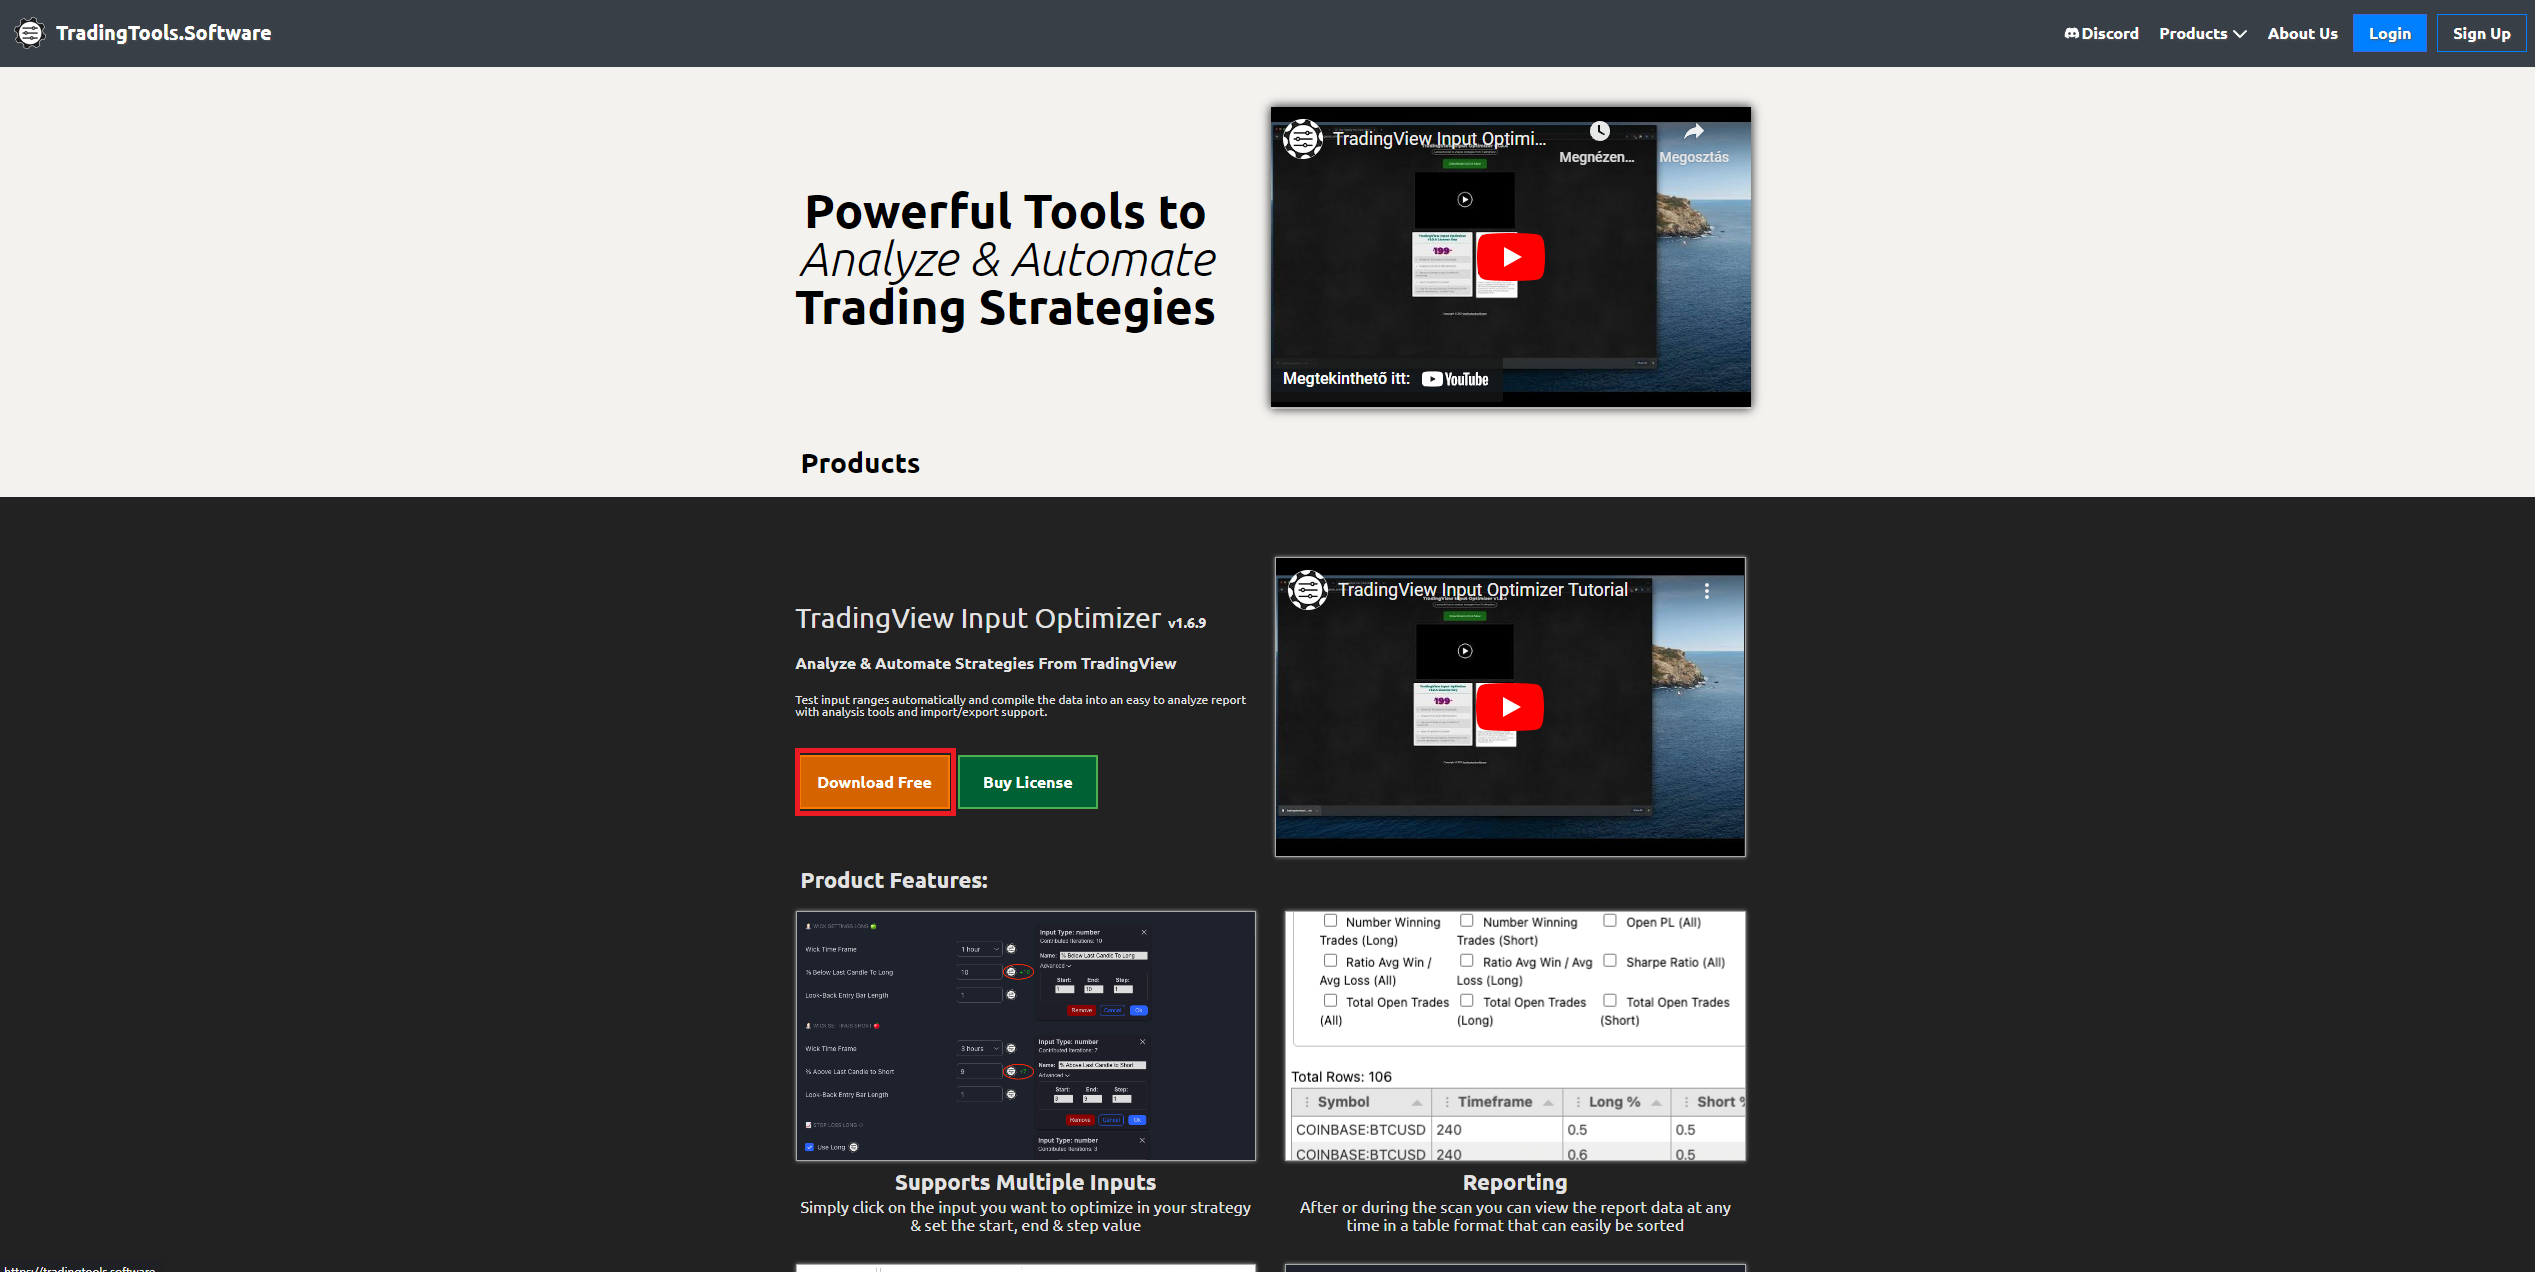
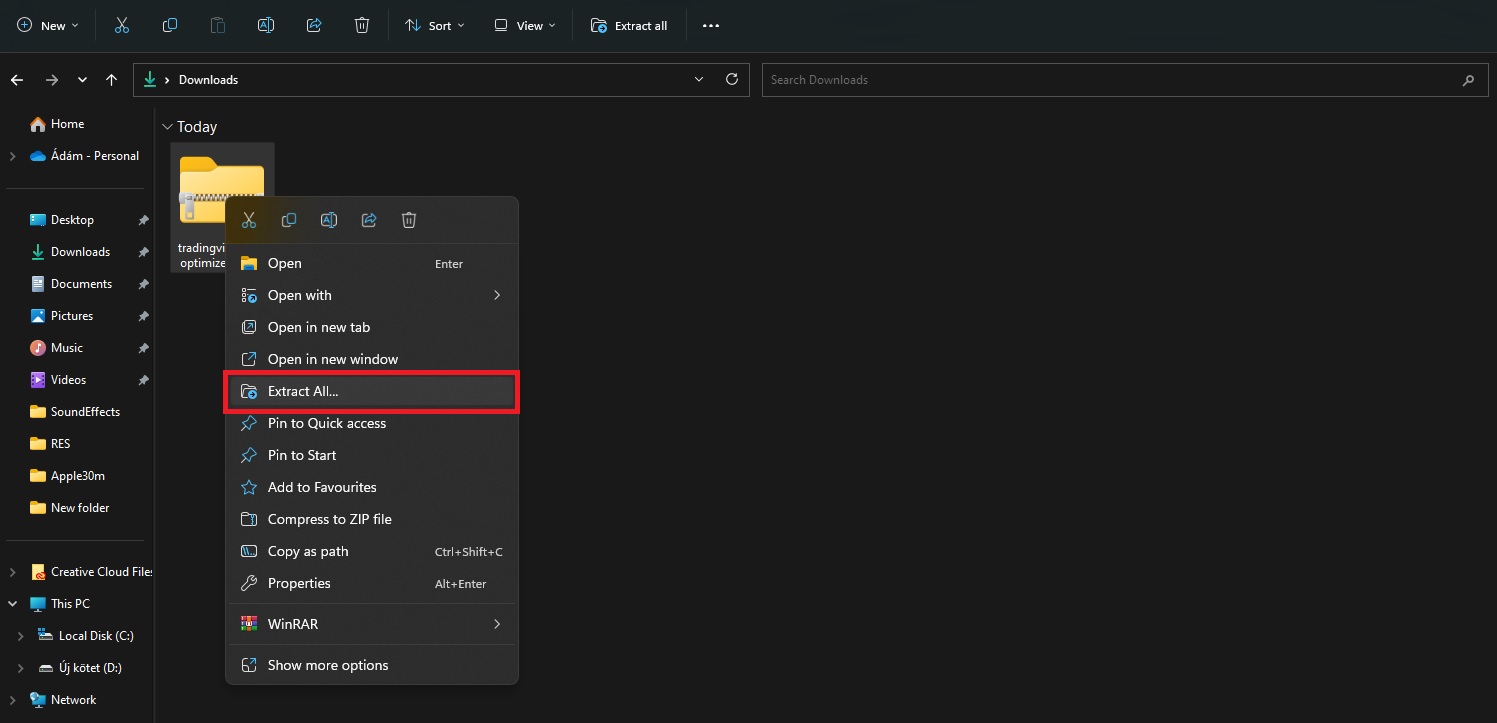
This will Download a Compressed File, open the downloaded file’s location with a File Manager, right click the ZIP file and click “Extract All”.
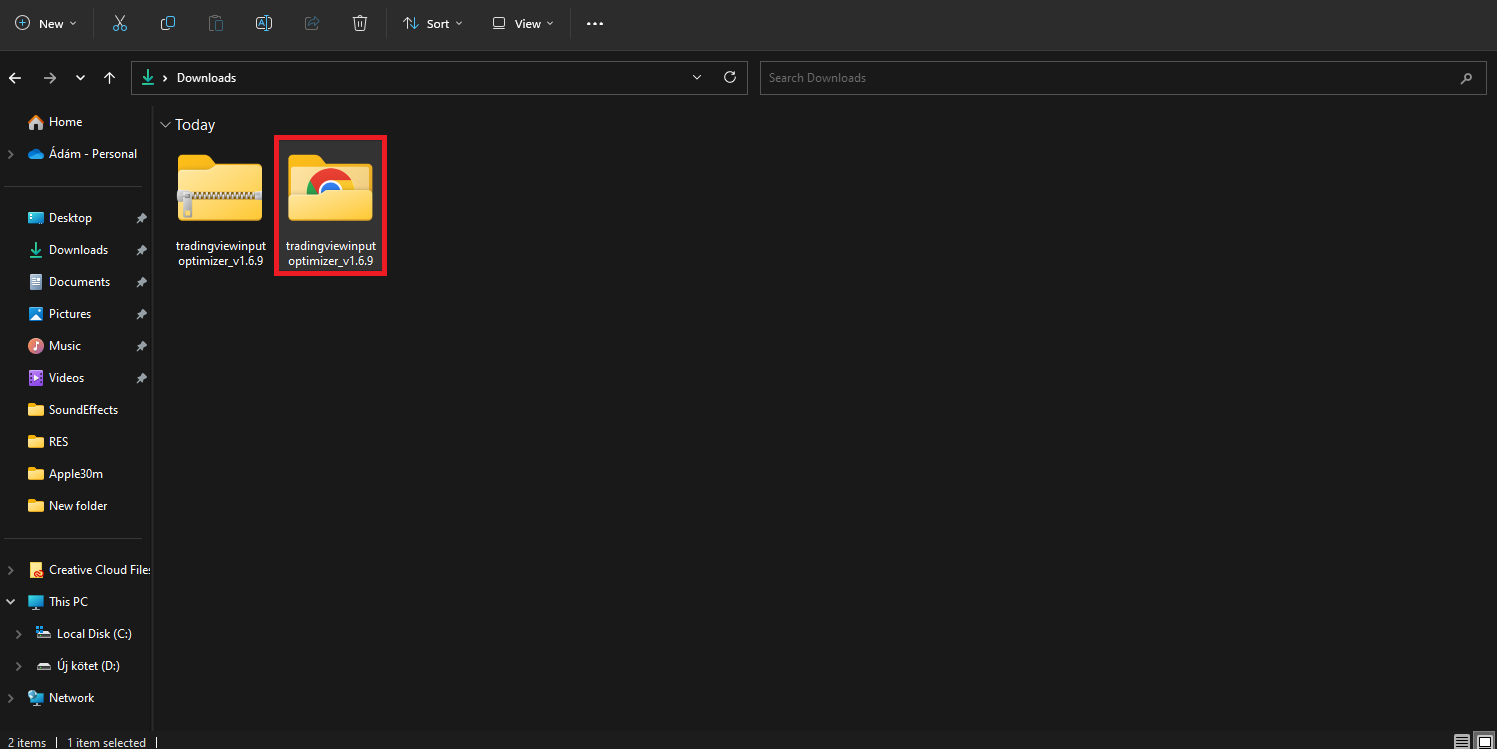
Then you should see the extracted file:
Step 2
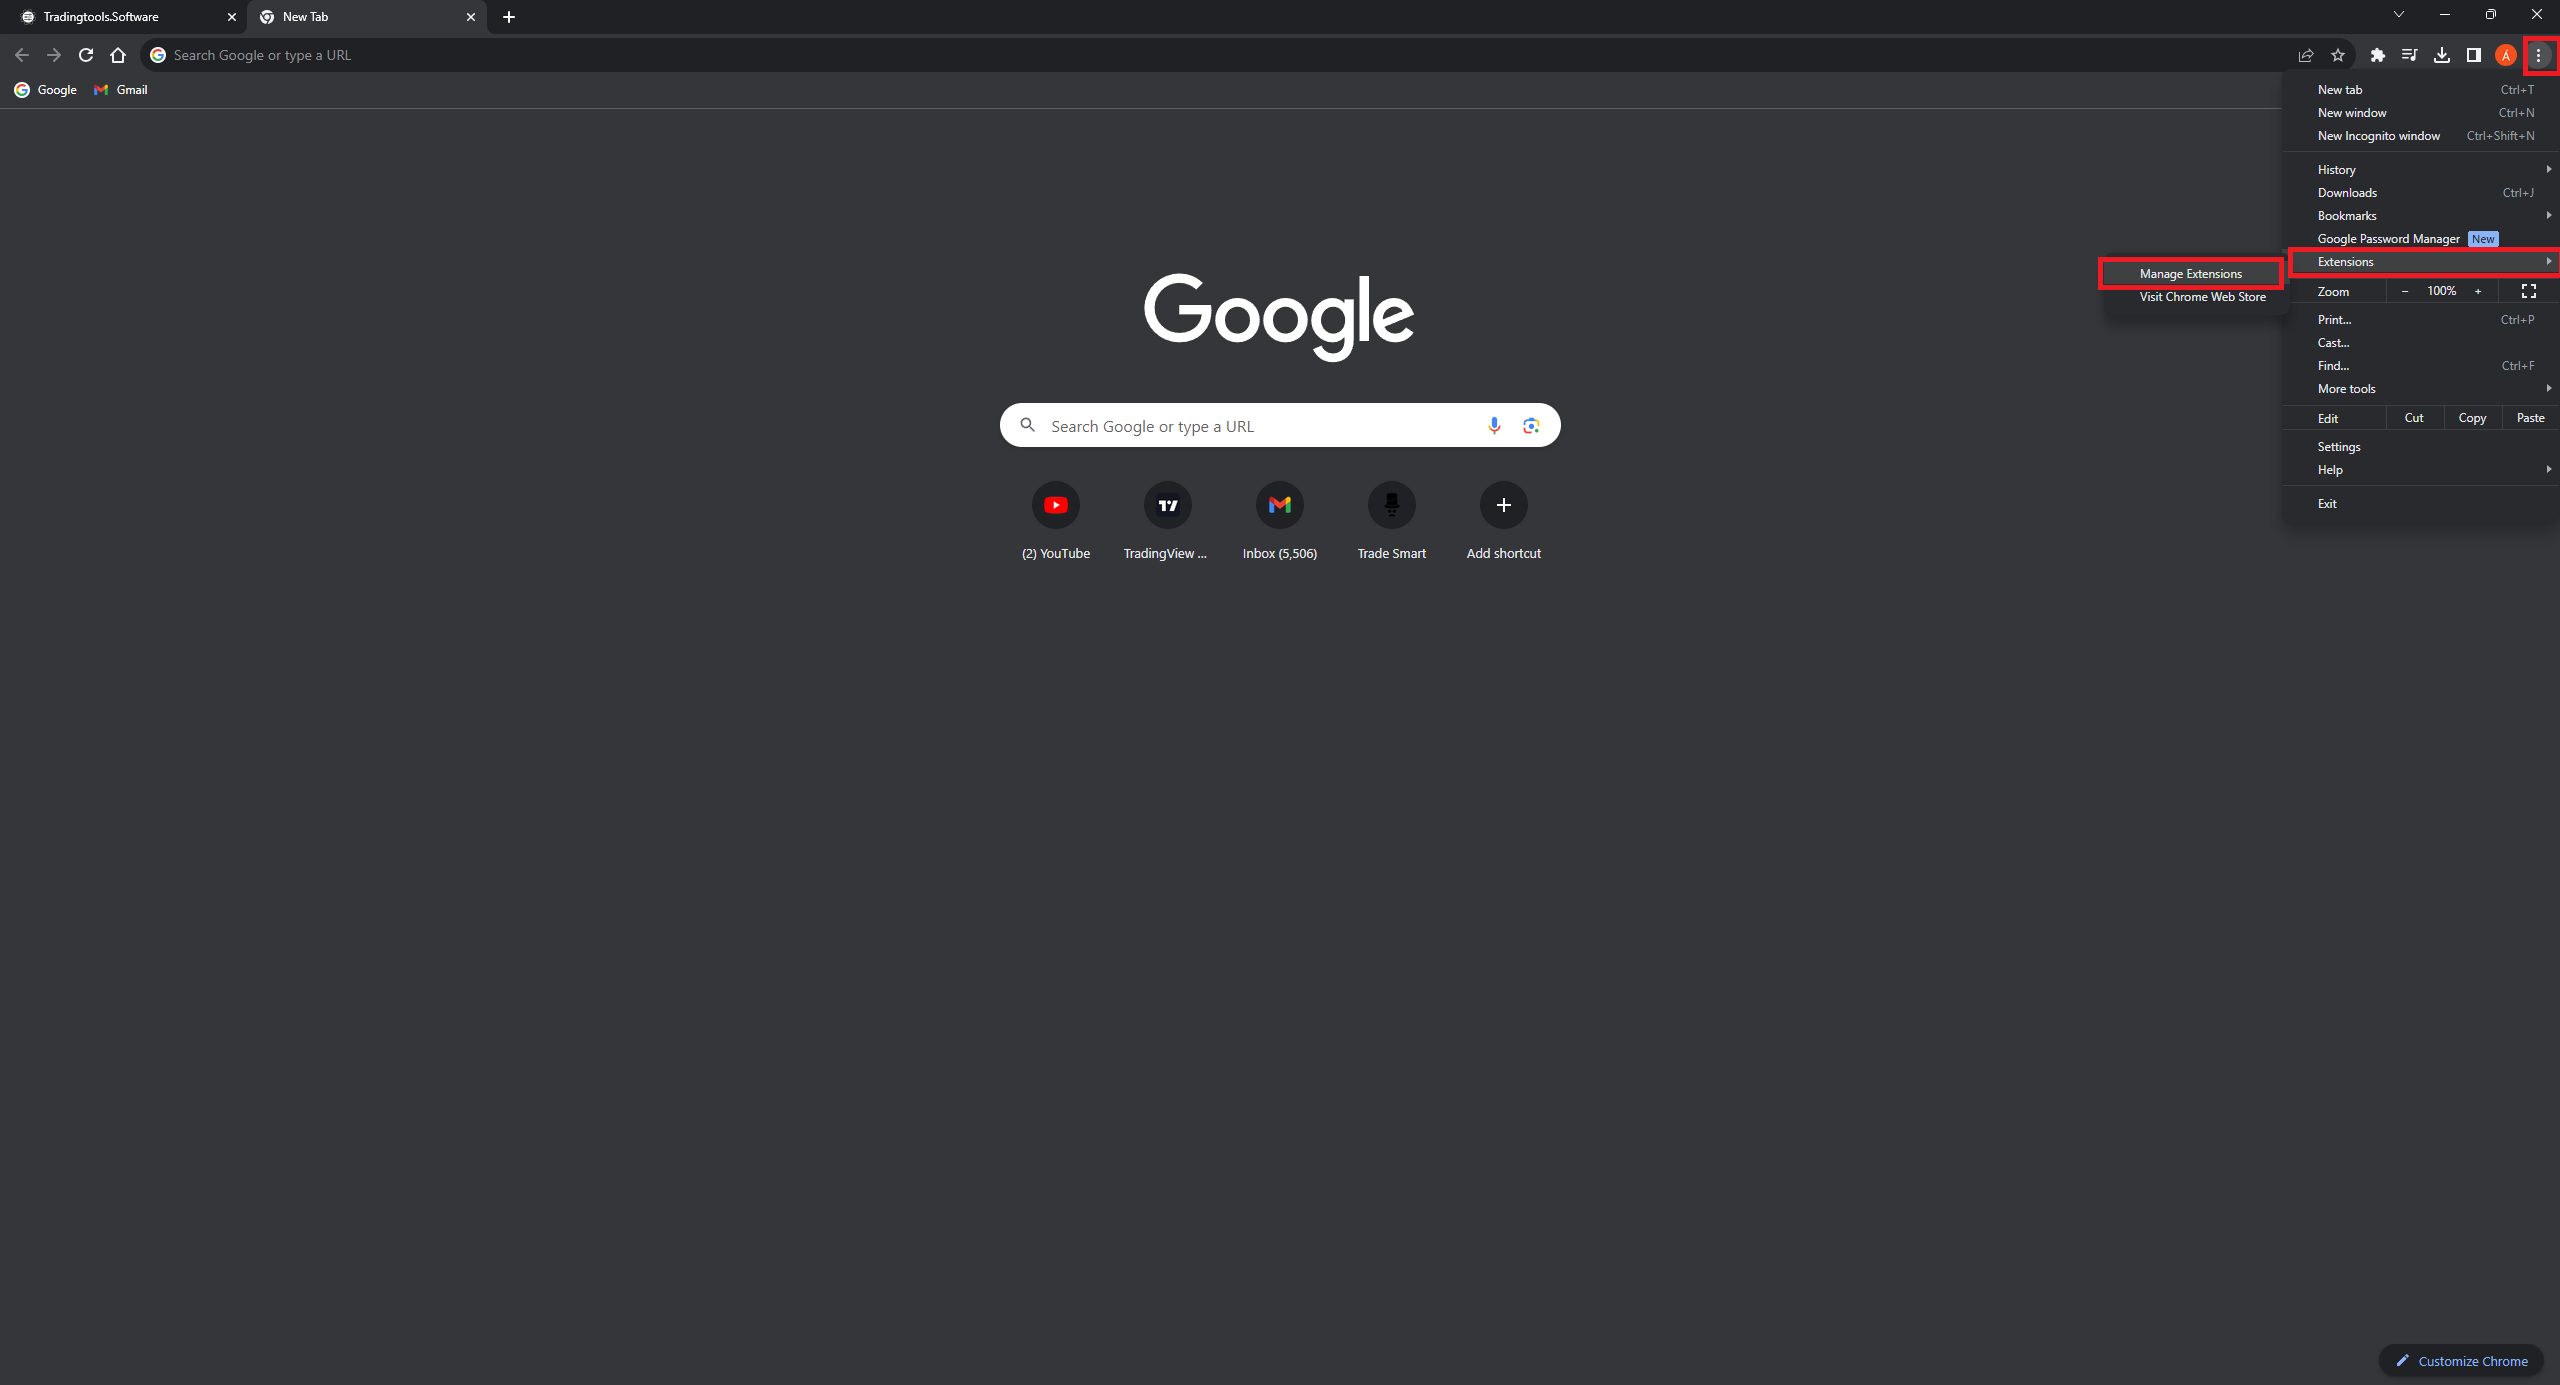
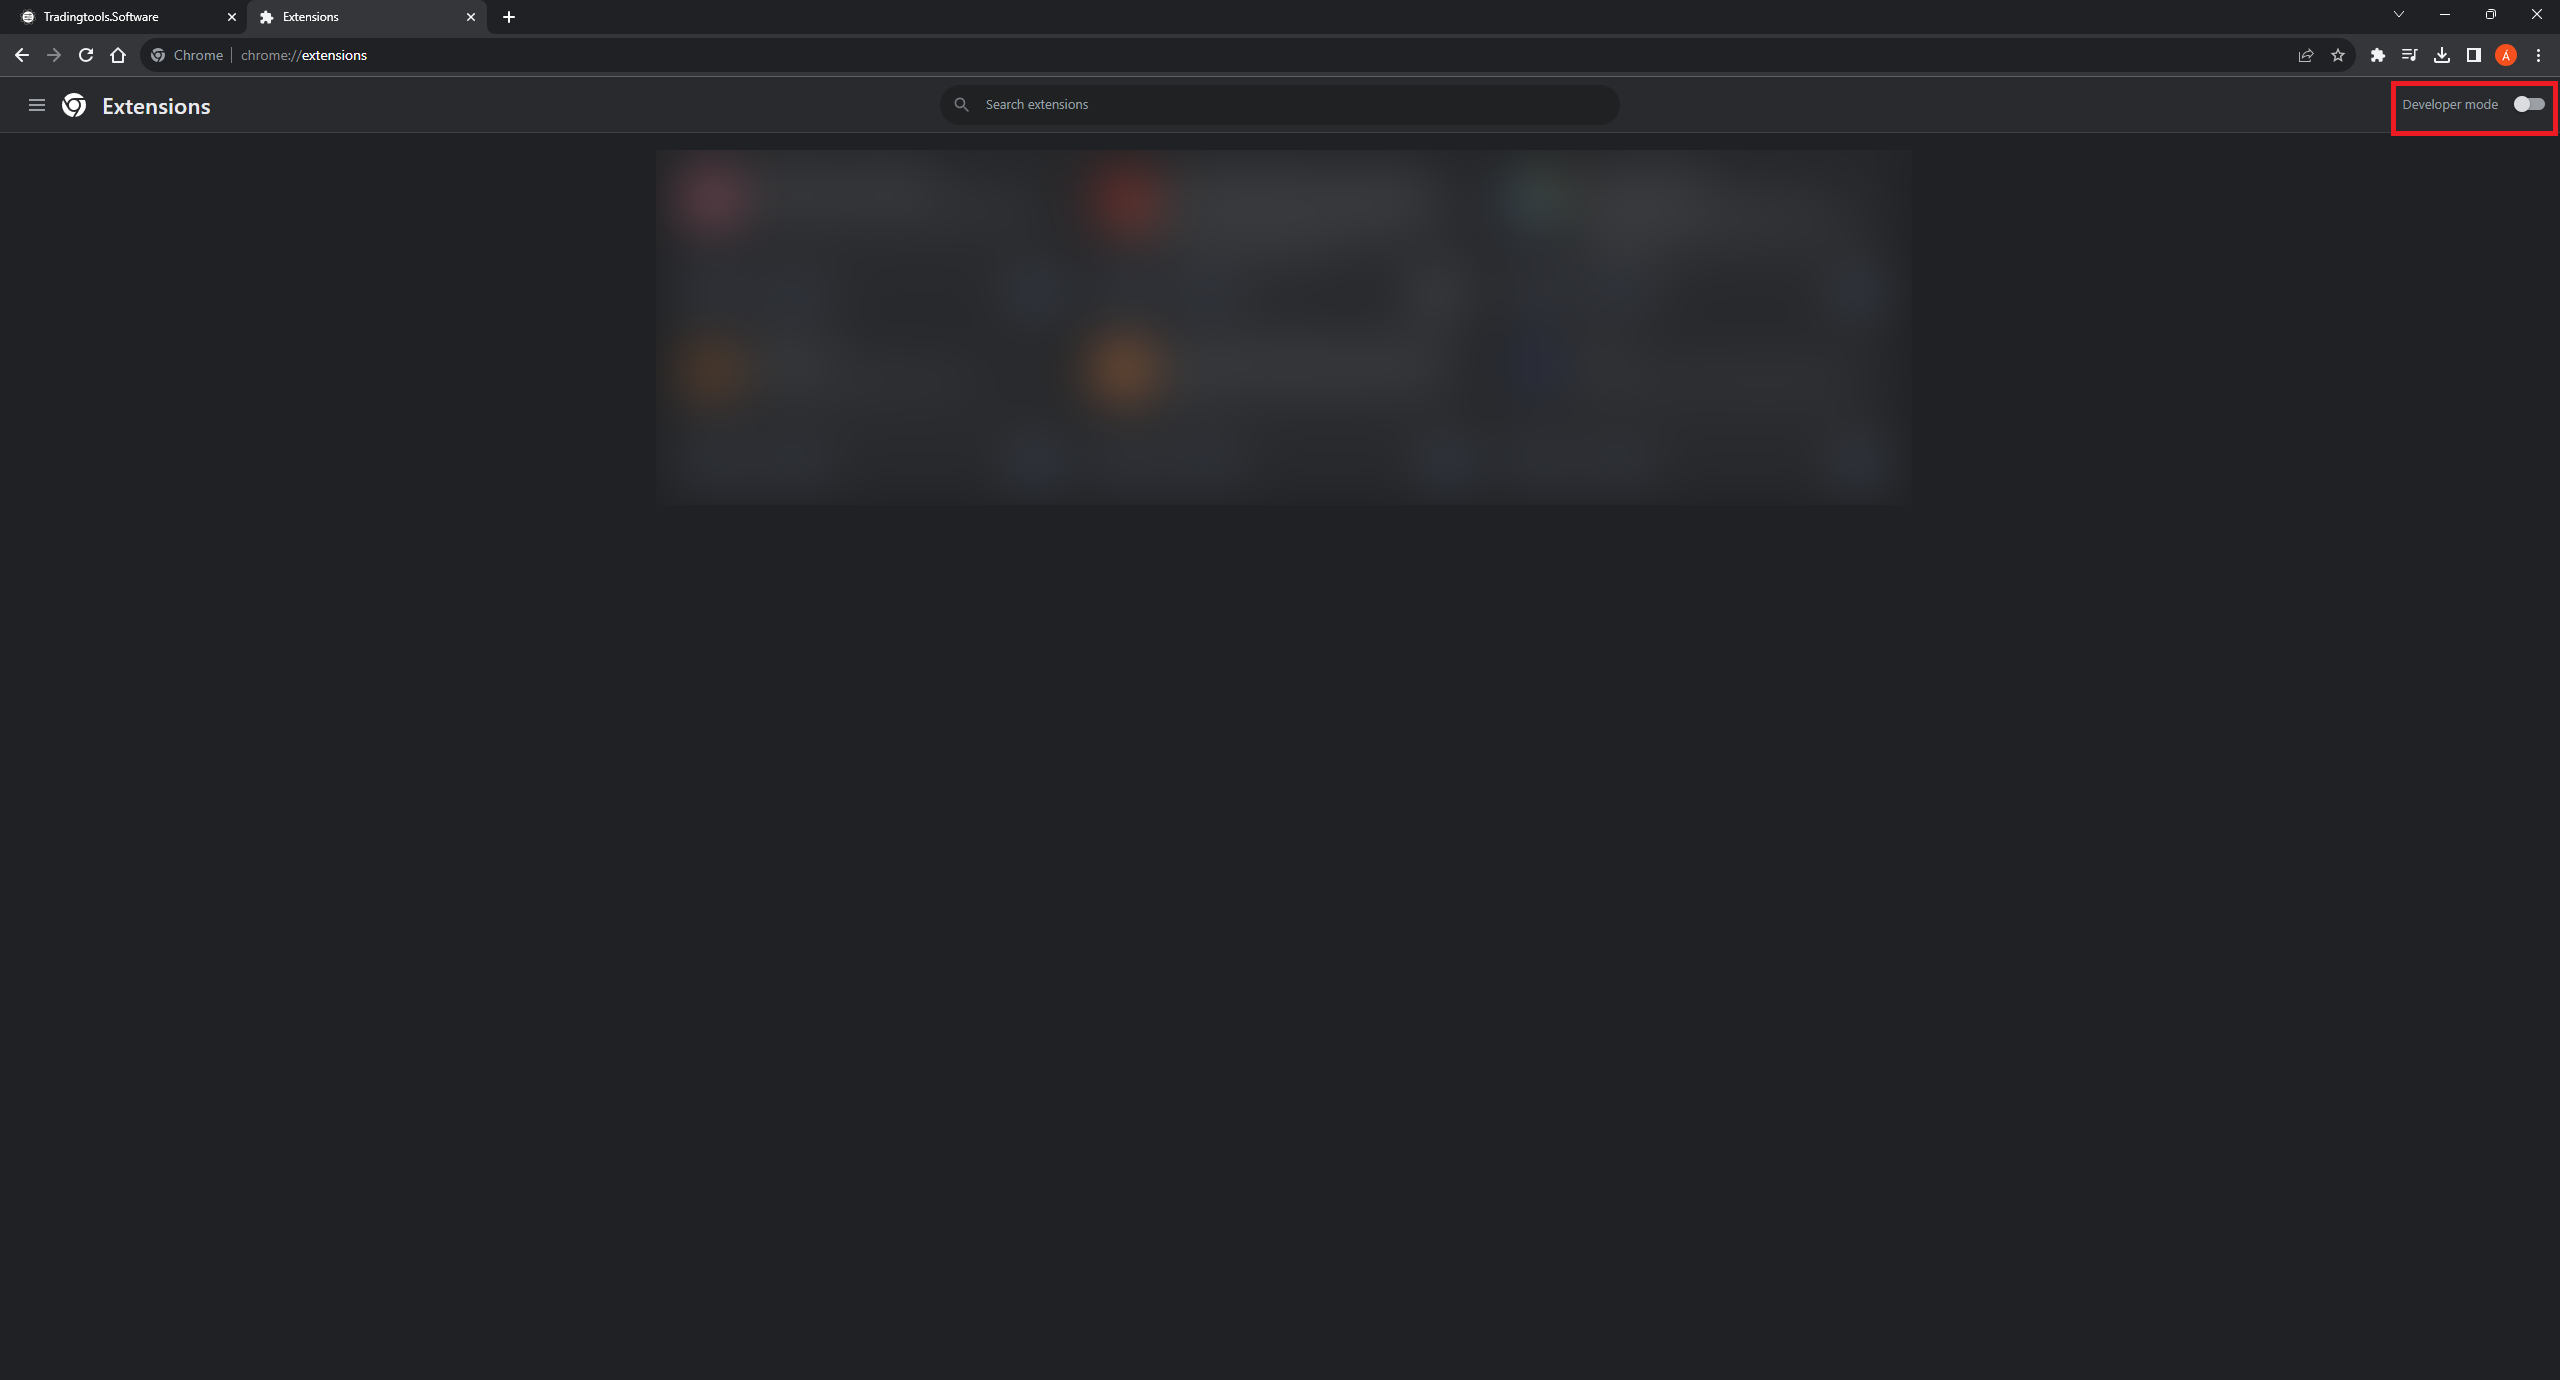
Open Chrome, in the top right corner click the 3Dots > Extensions > Manage Extensions.
Enable Developer Mode.
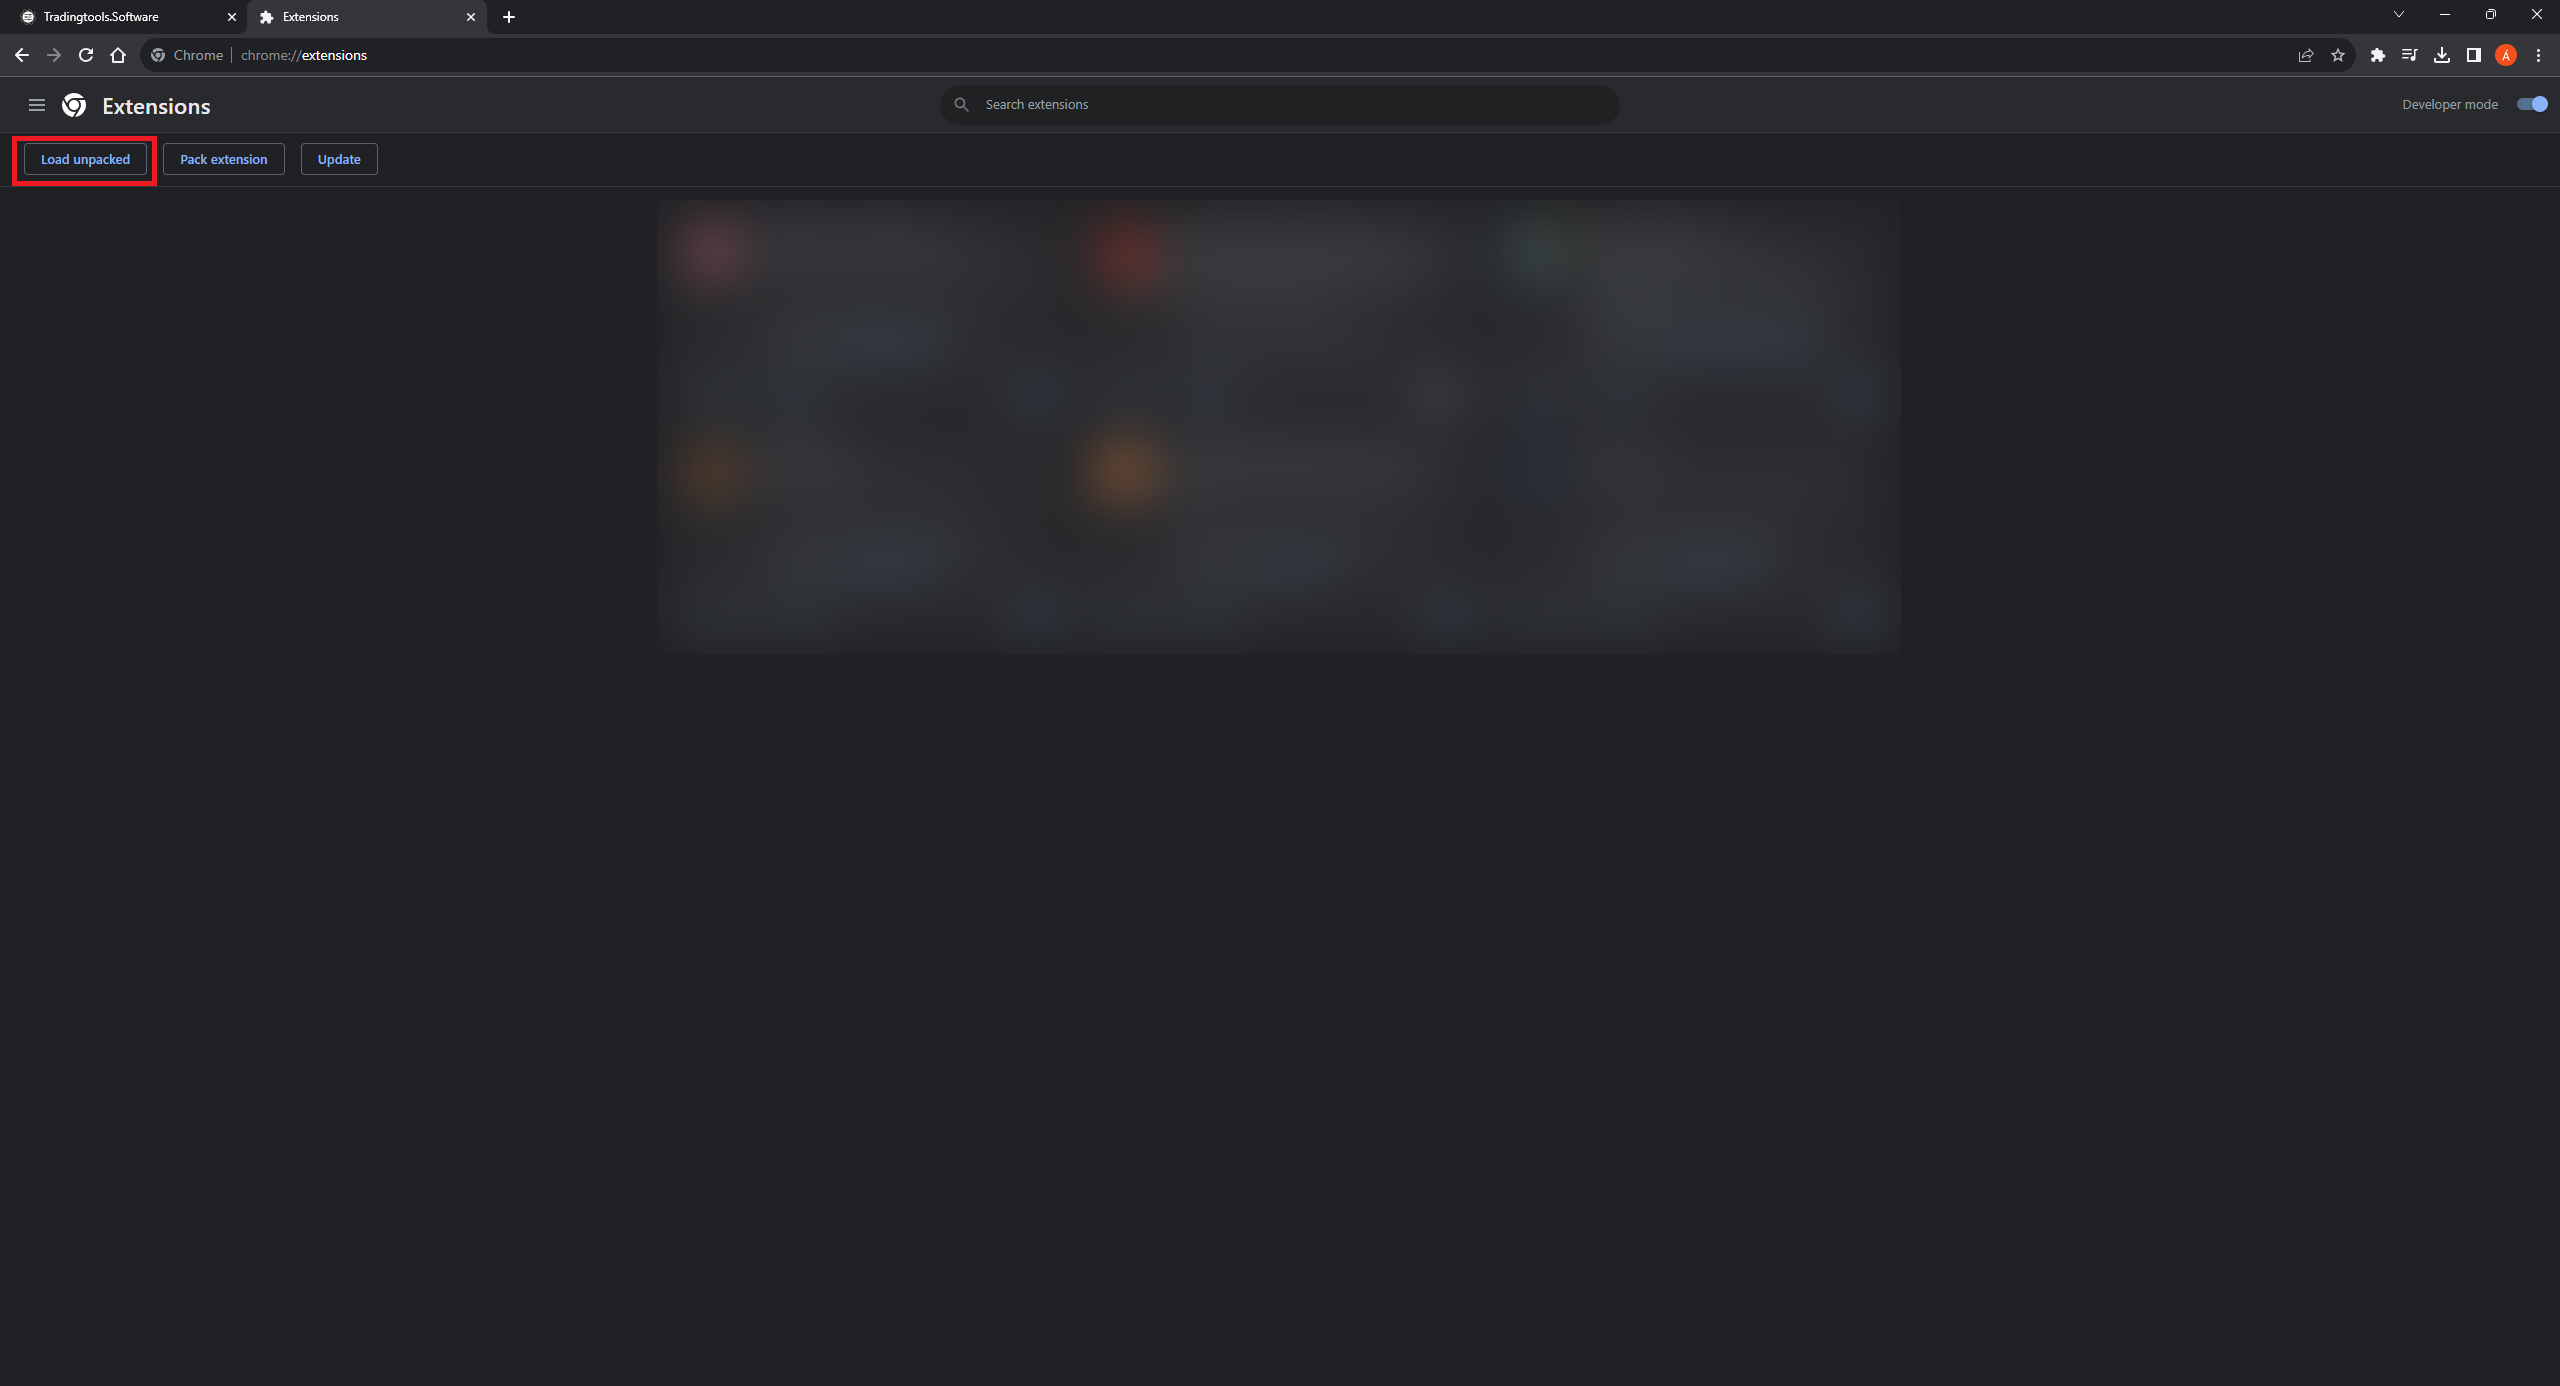
Click Load Unpacked.
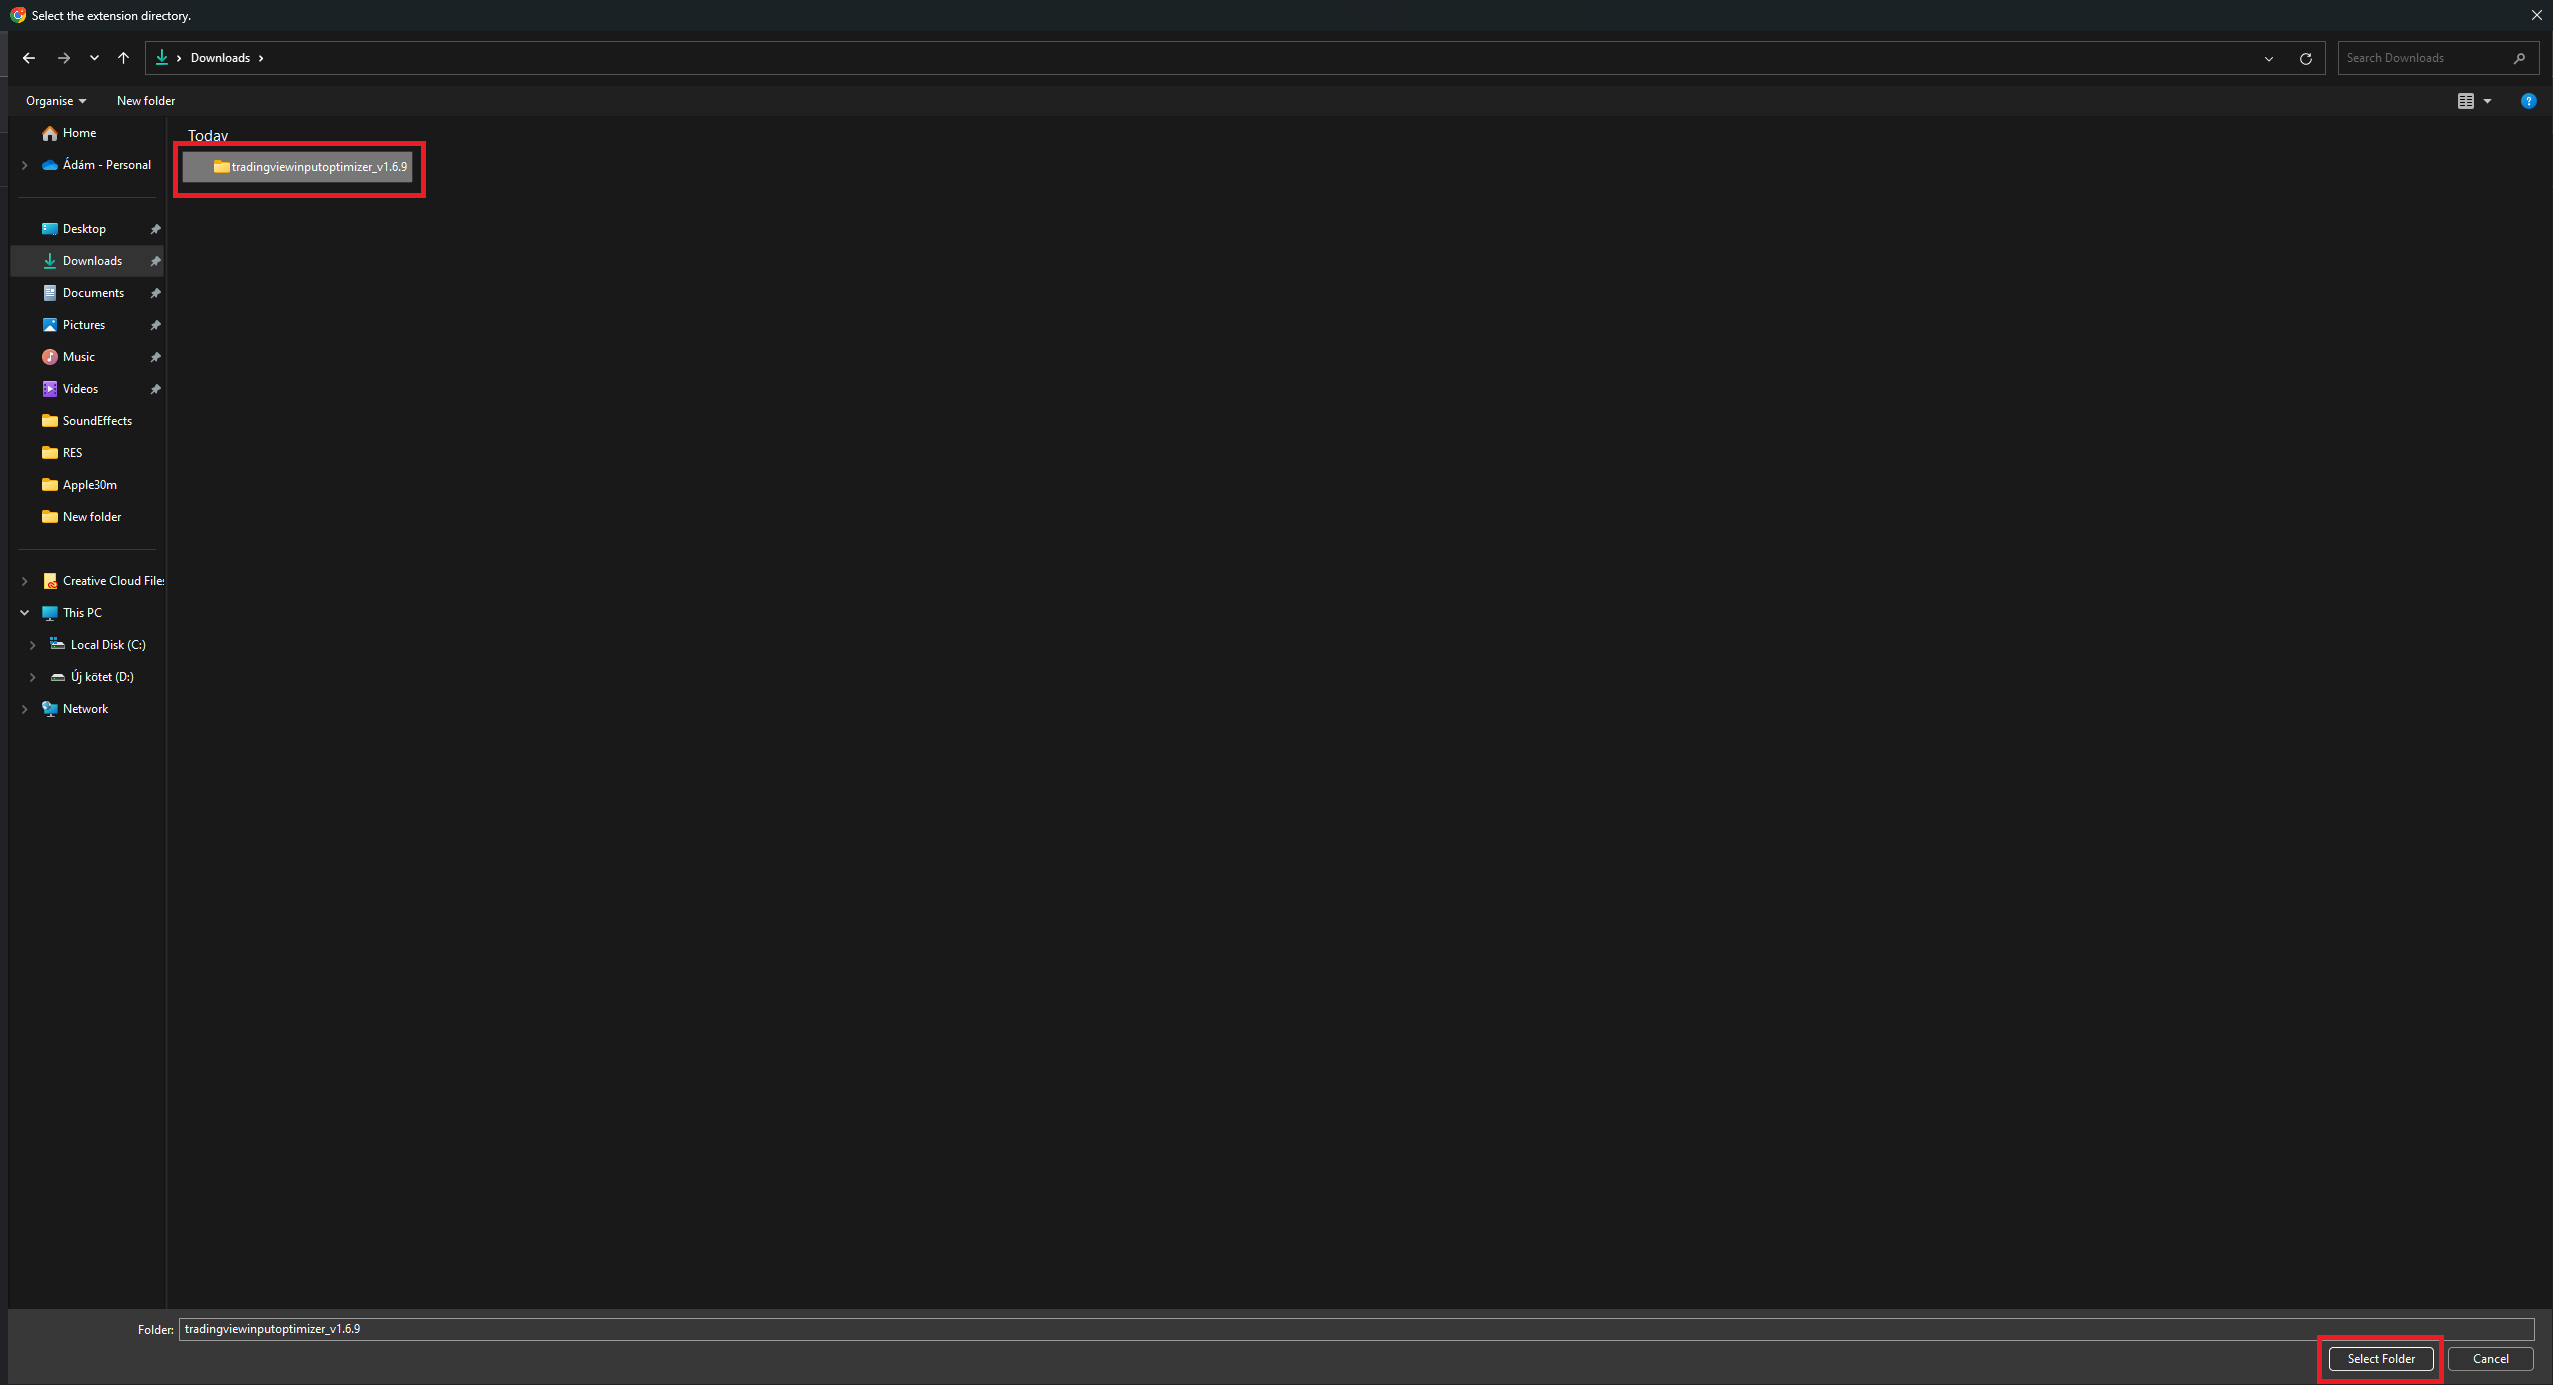
Select the extracted folder from Step 1, then click “Select Folder”.
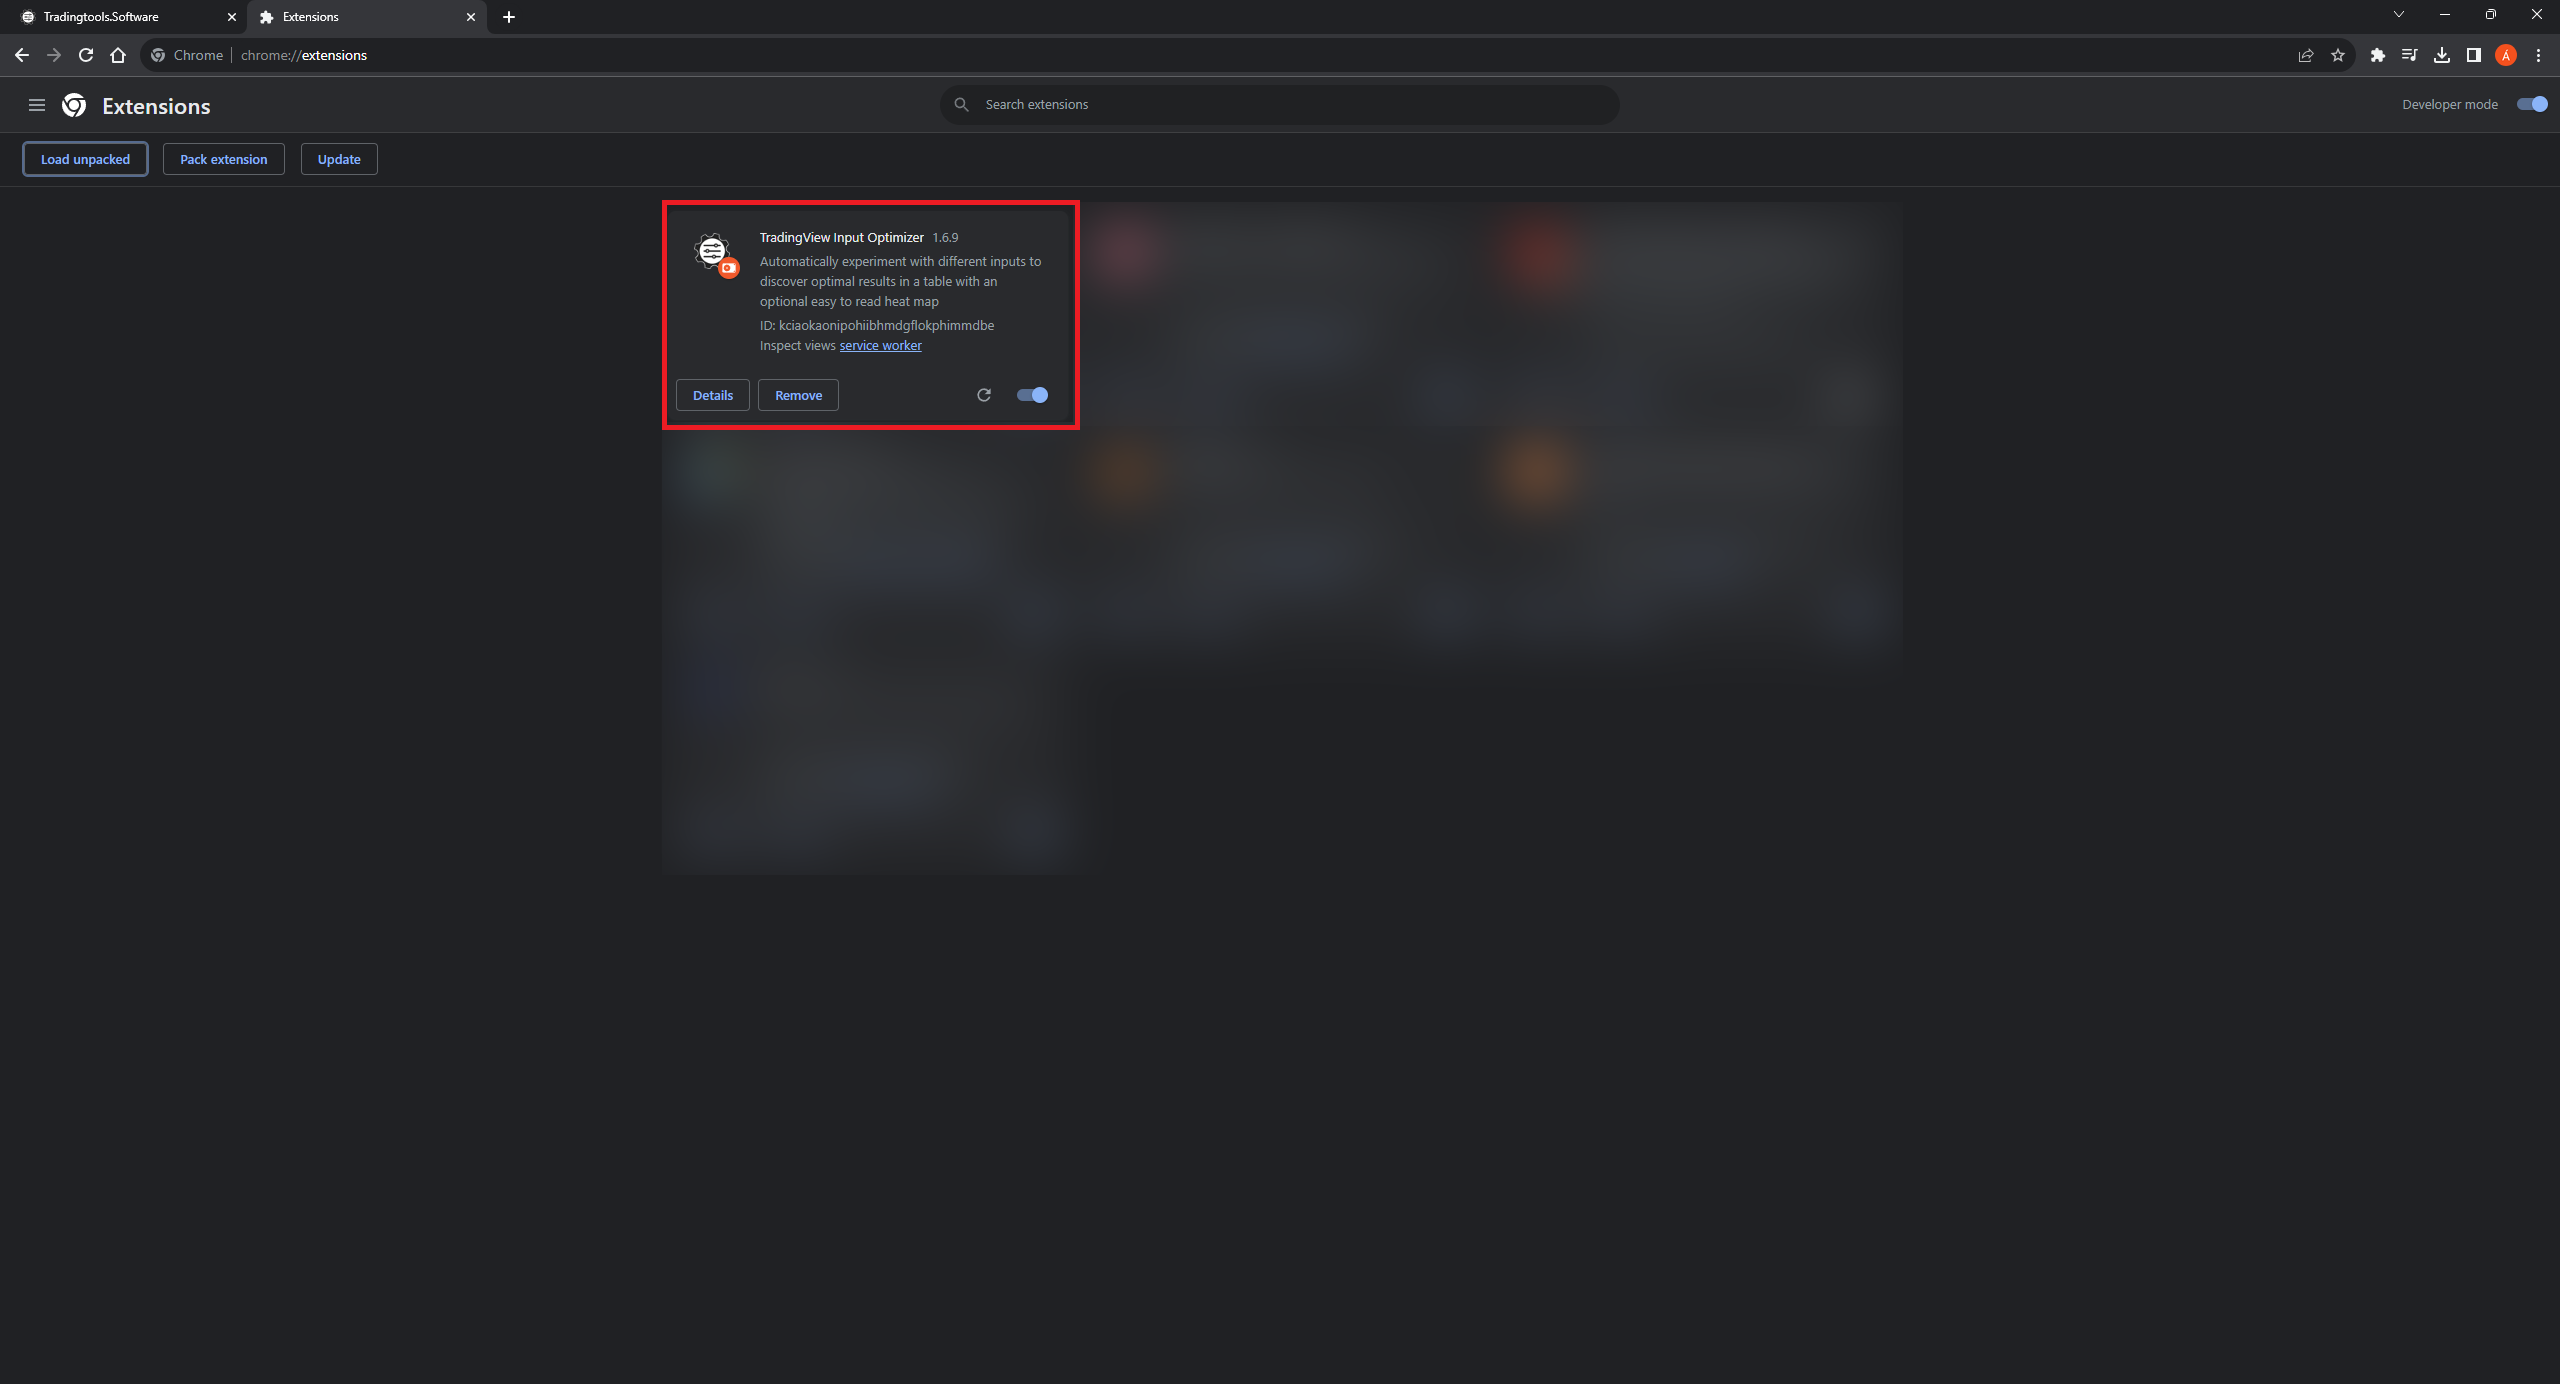
You should see the “Tradingview Input Optimizer” appear amongst your Chrome Extensions.
Step 3
Open Tradingview, and add one of our scripts to the chart, in this case I will you Bitcoin 1 Day chart with our Multi Entry Signal Strategy (Tier 1).
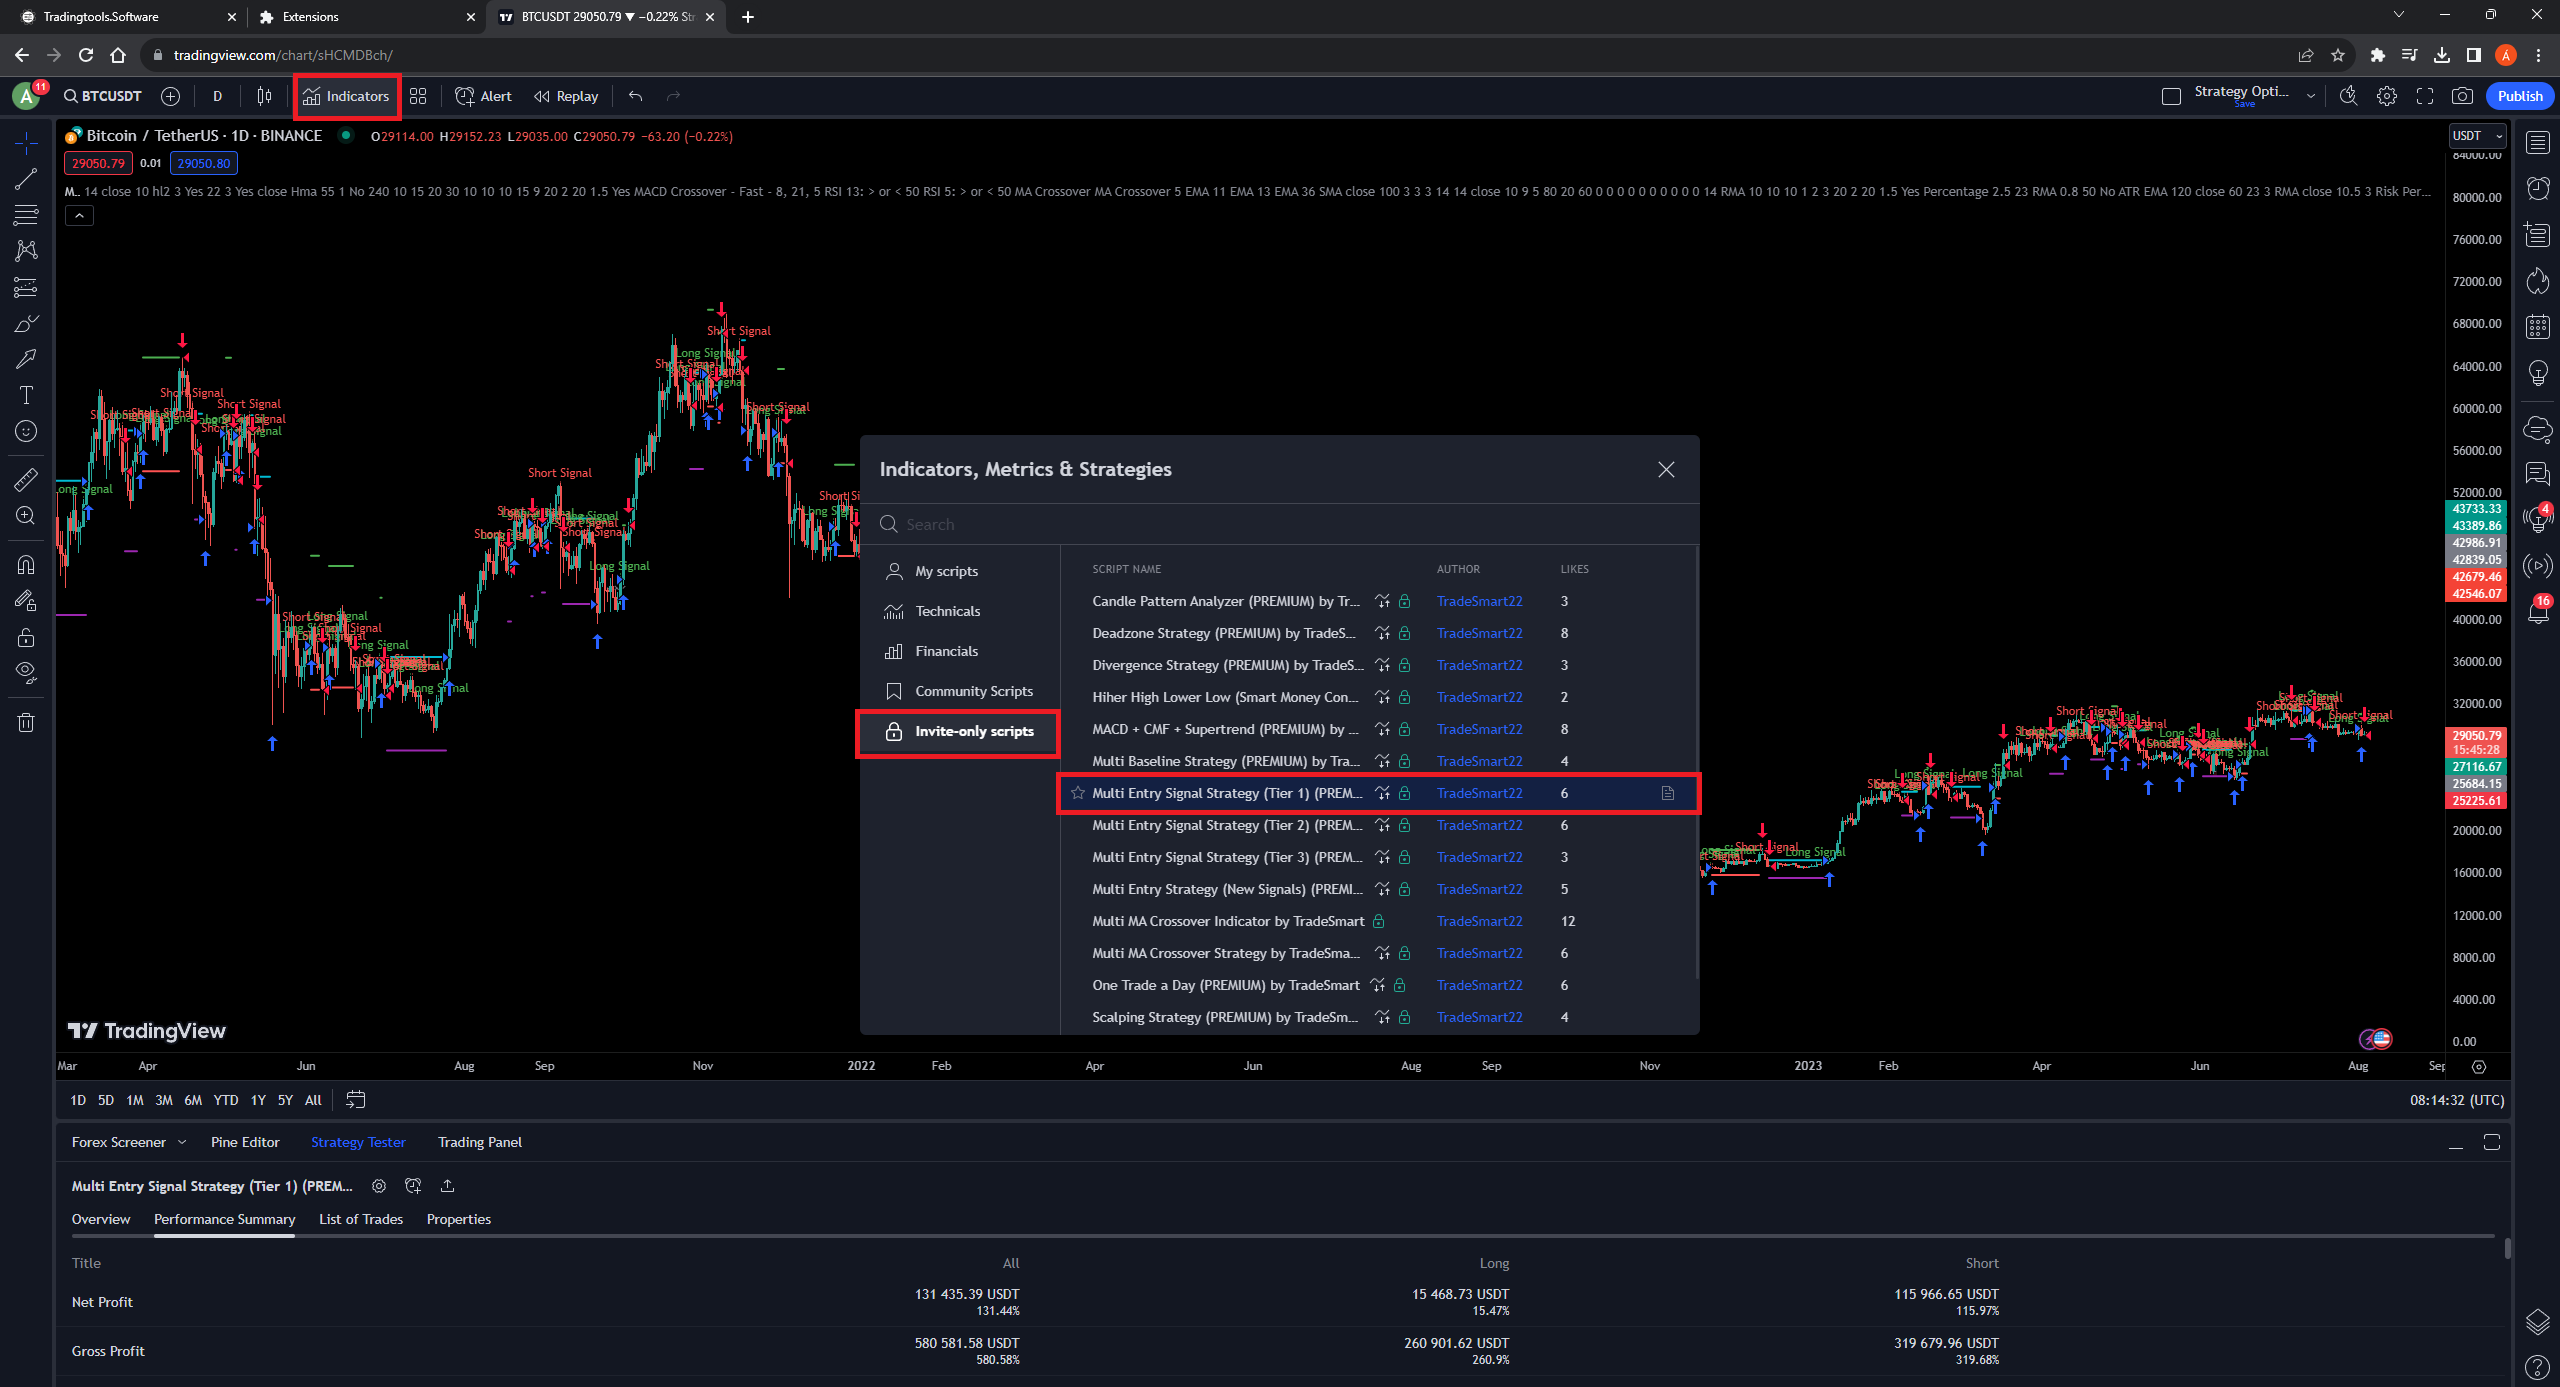
Next Click the “Strategy Settings” button.
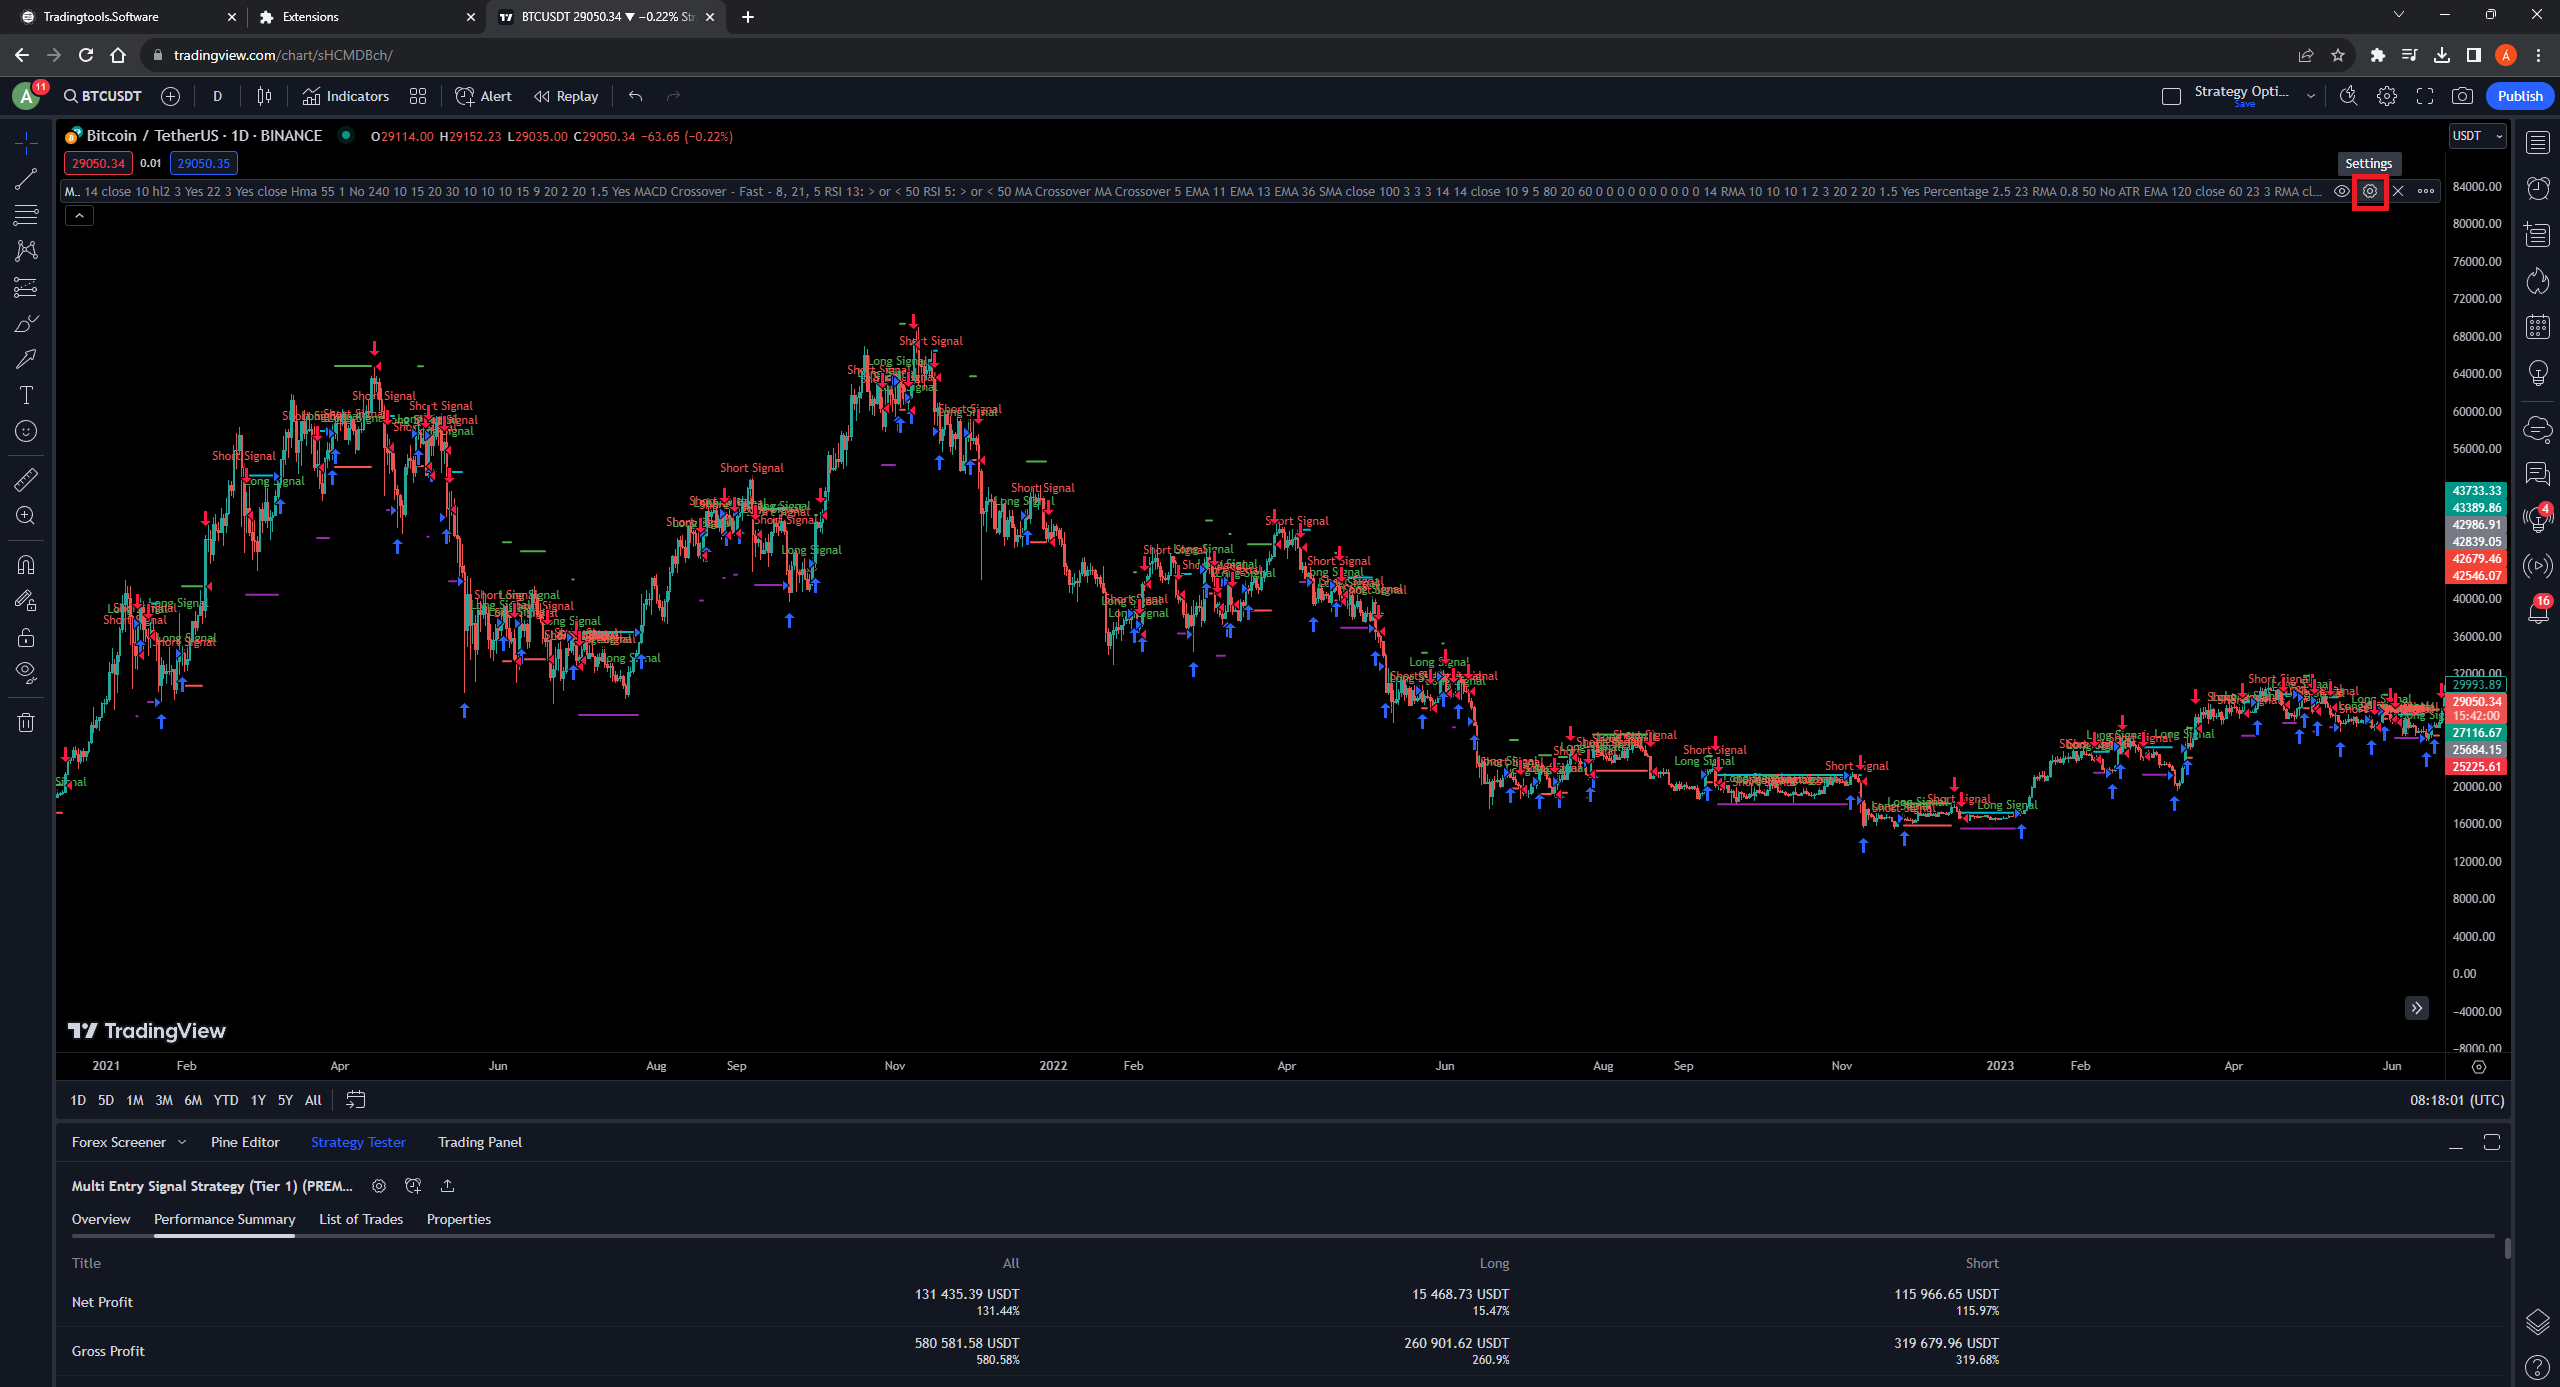
You should see a screen similiar to this:
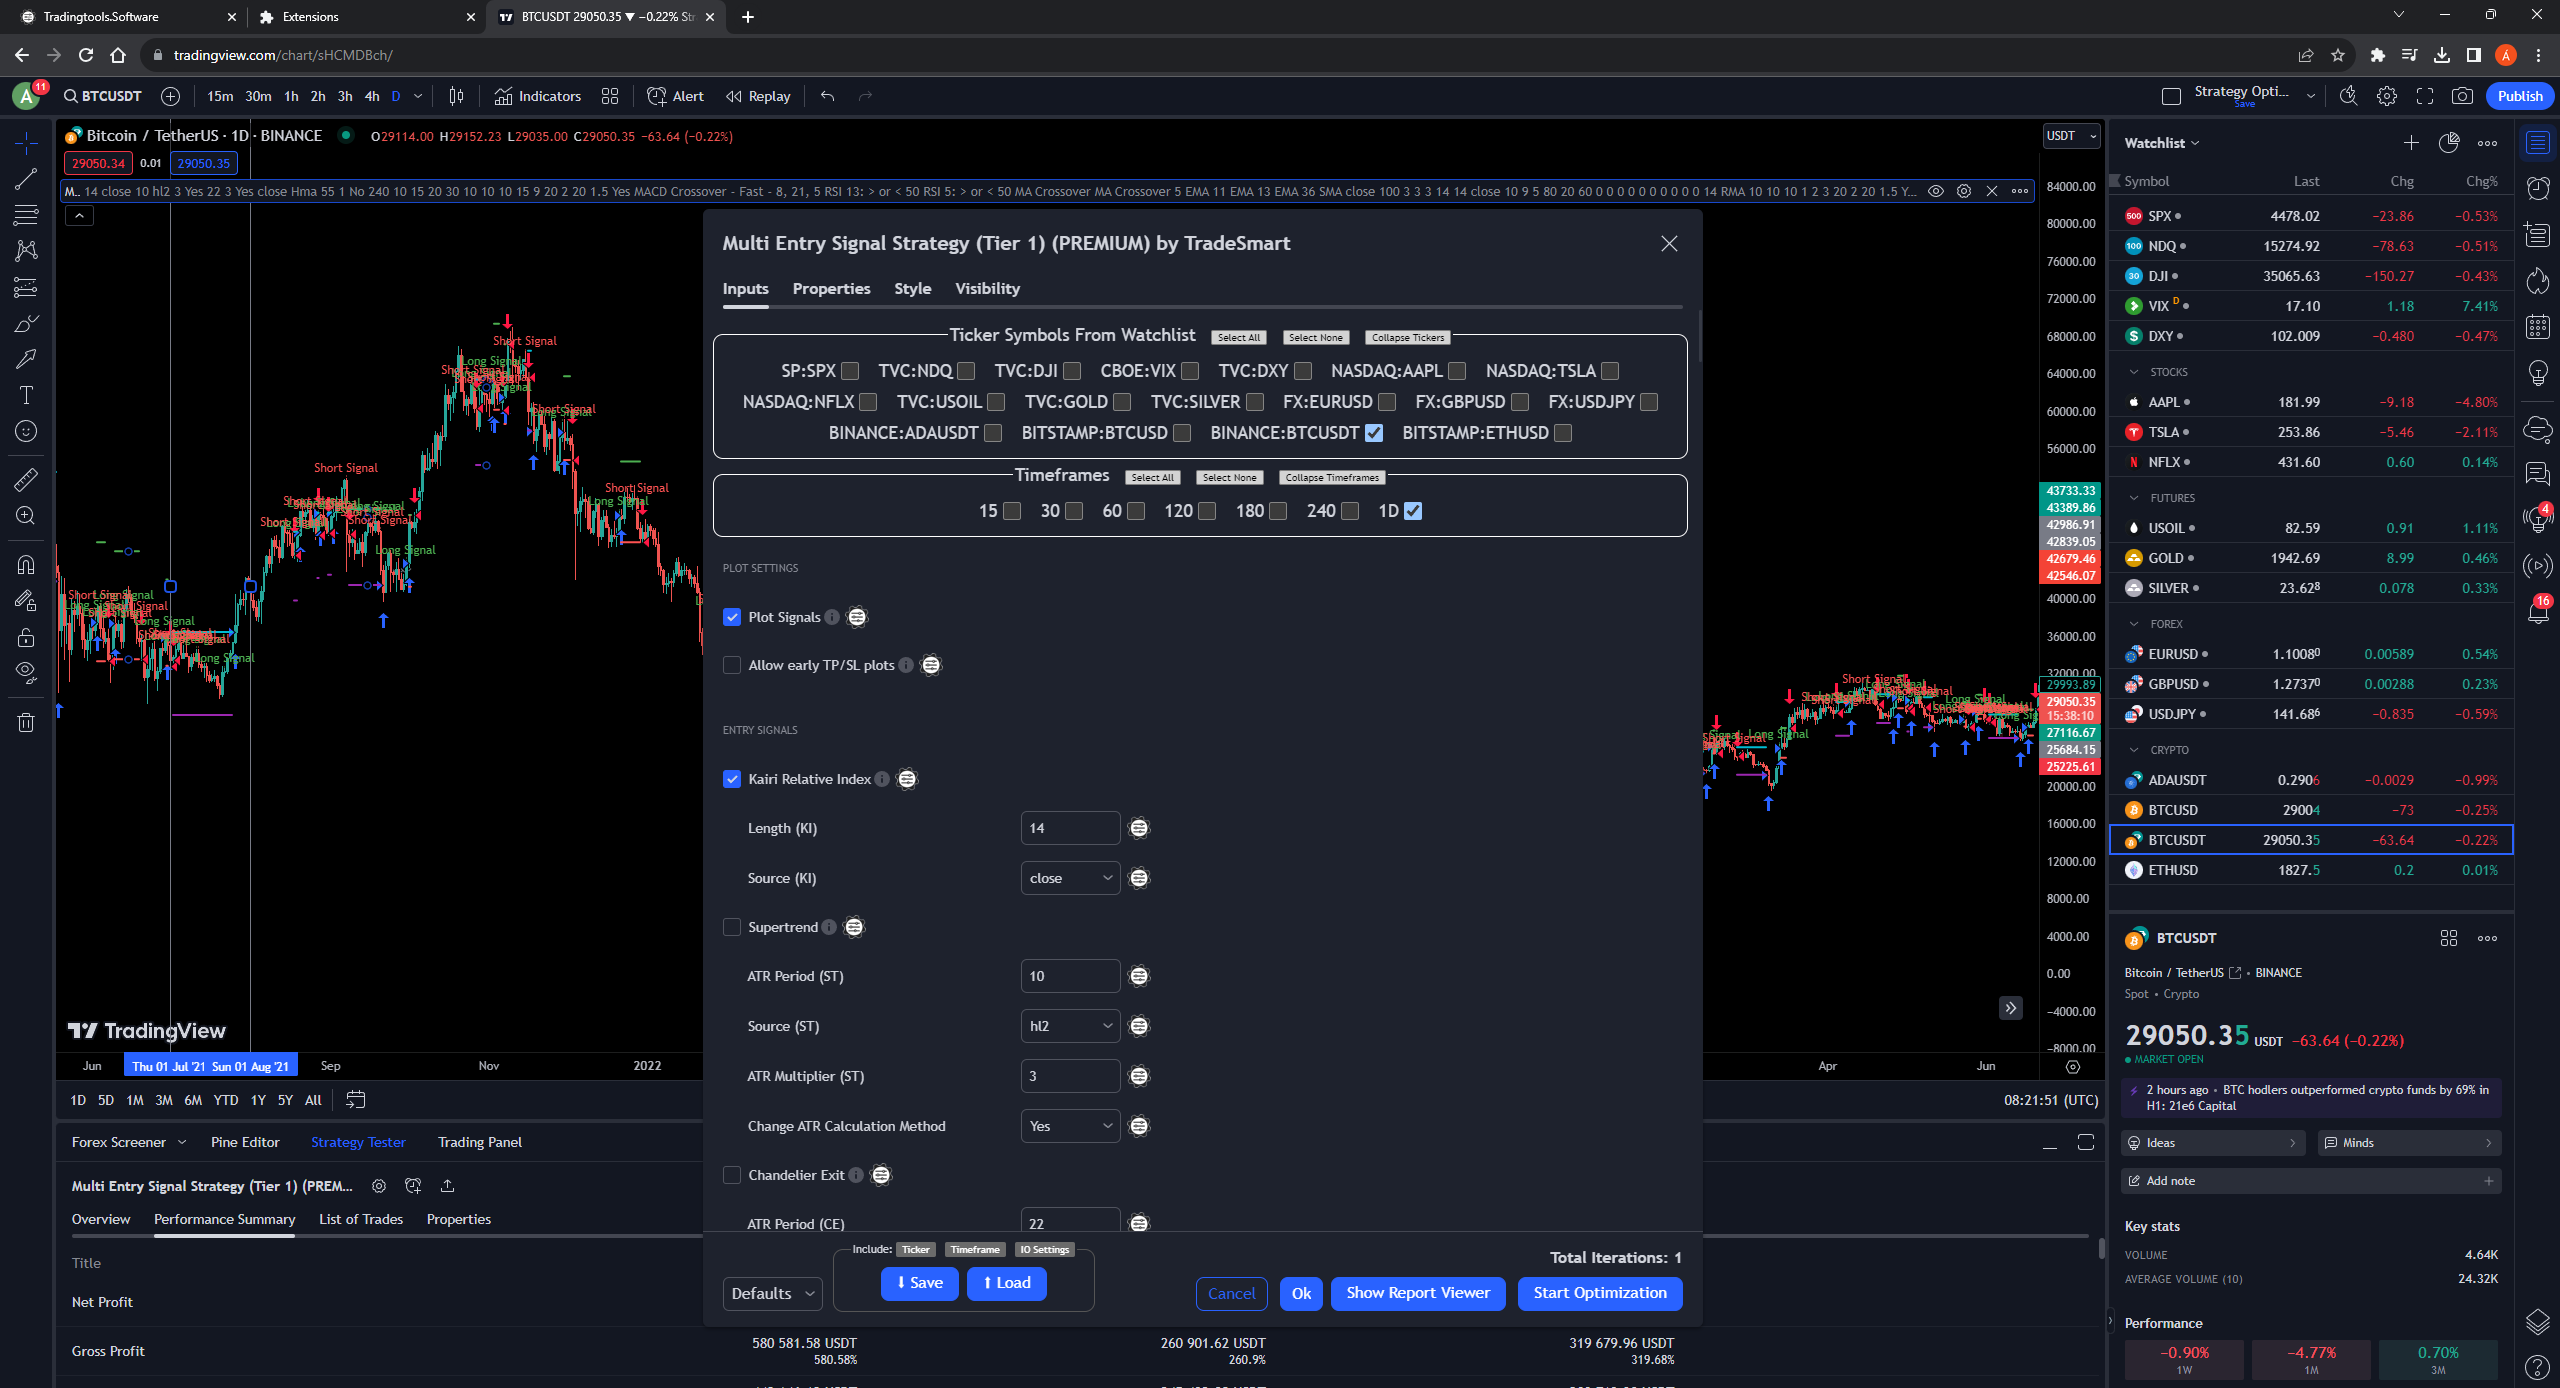
How to Optimize
Ticker Symbols from Watchlist
Using this tool, you can optimize for multiple assets at the same time, the list you can see in the middle is the same that you can see on the right (Watchlist).
Let’s say that you would like to optimize for BNBUSDT and BTCUSDT.
You can add the BNB to the optimizer, if you add it to you Watchlist:
To add it to my Crypto list right click “Crypto” and click “Add Symbol”.
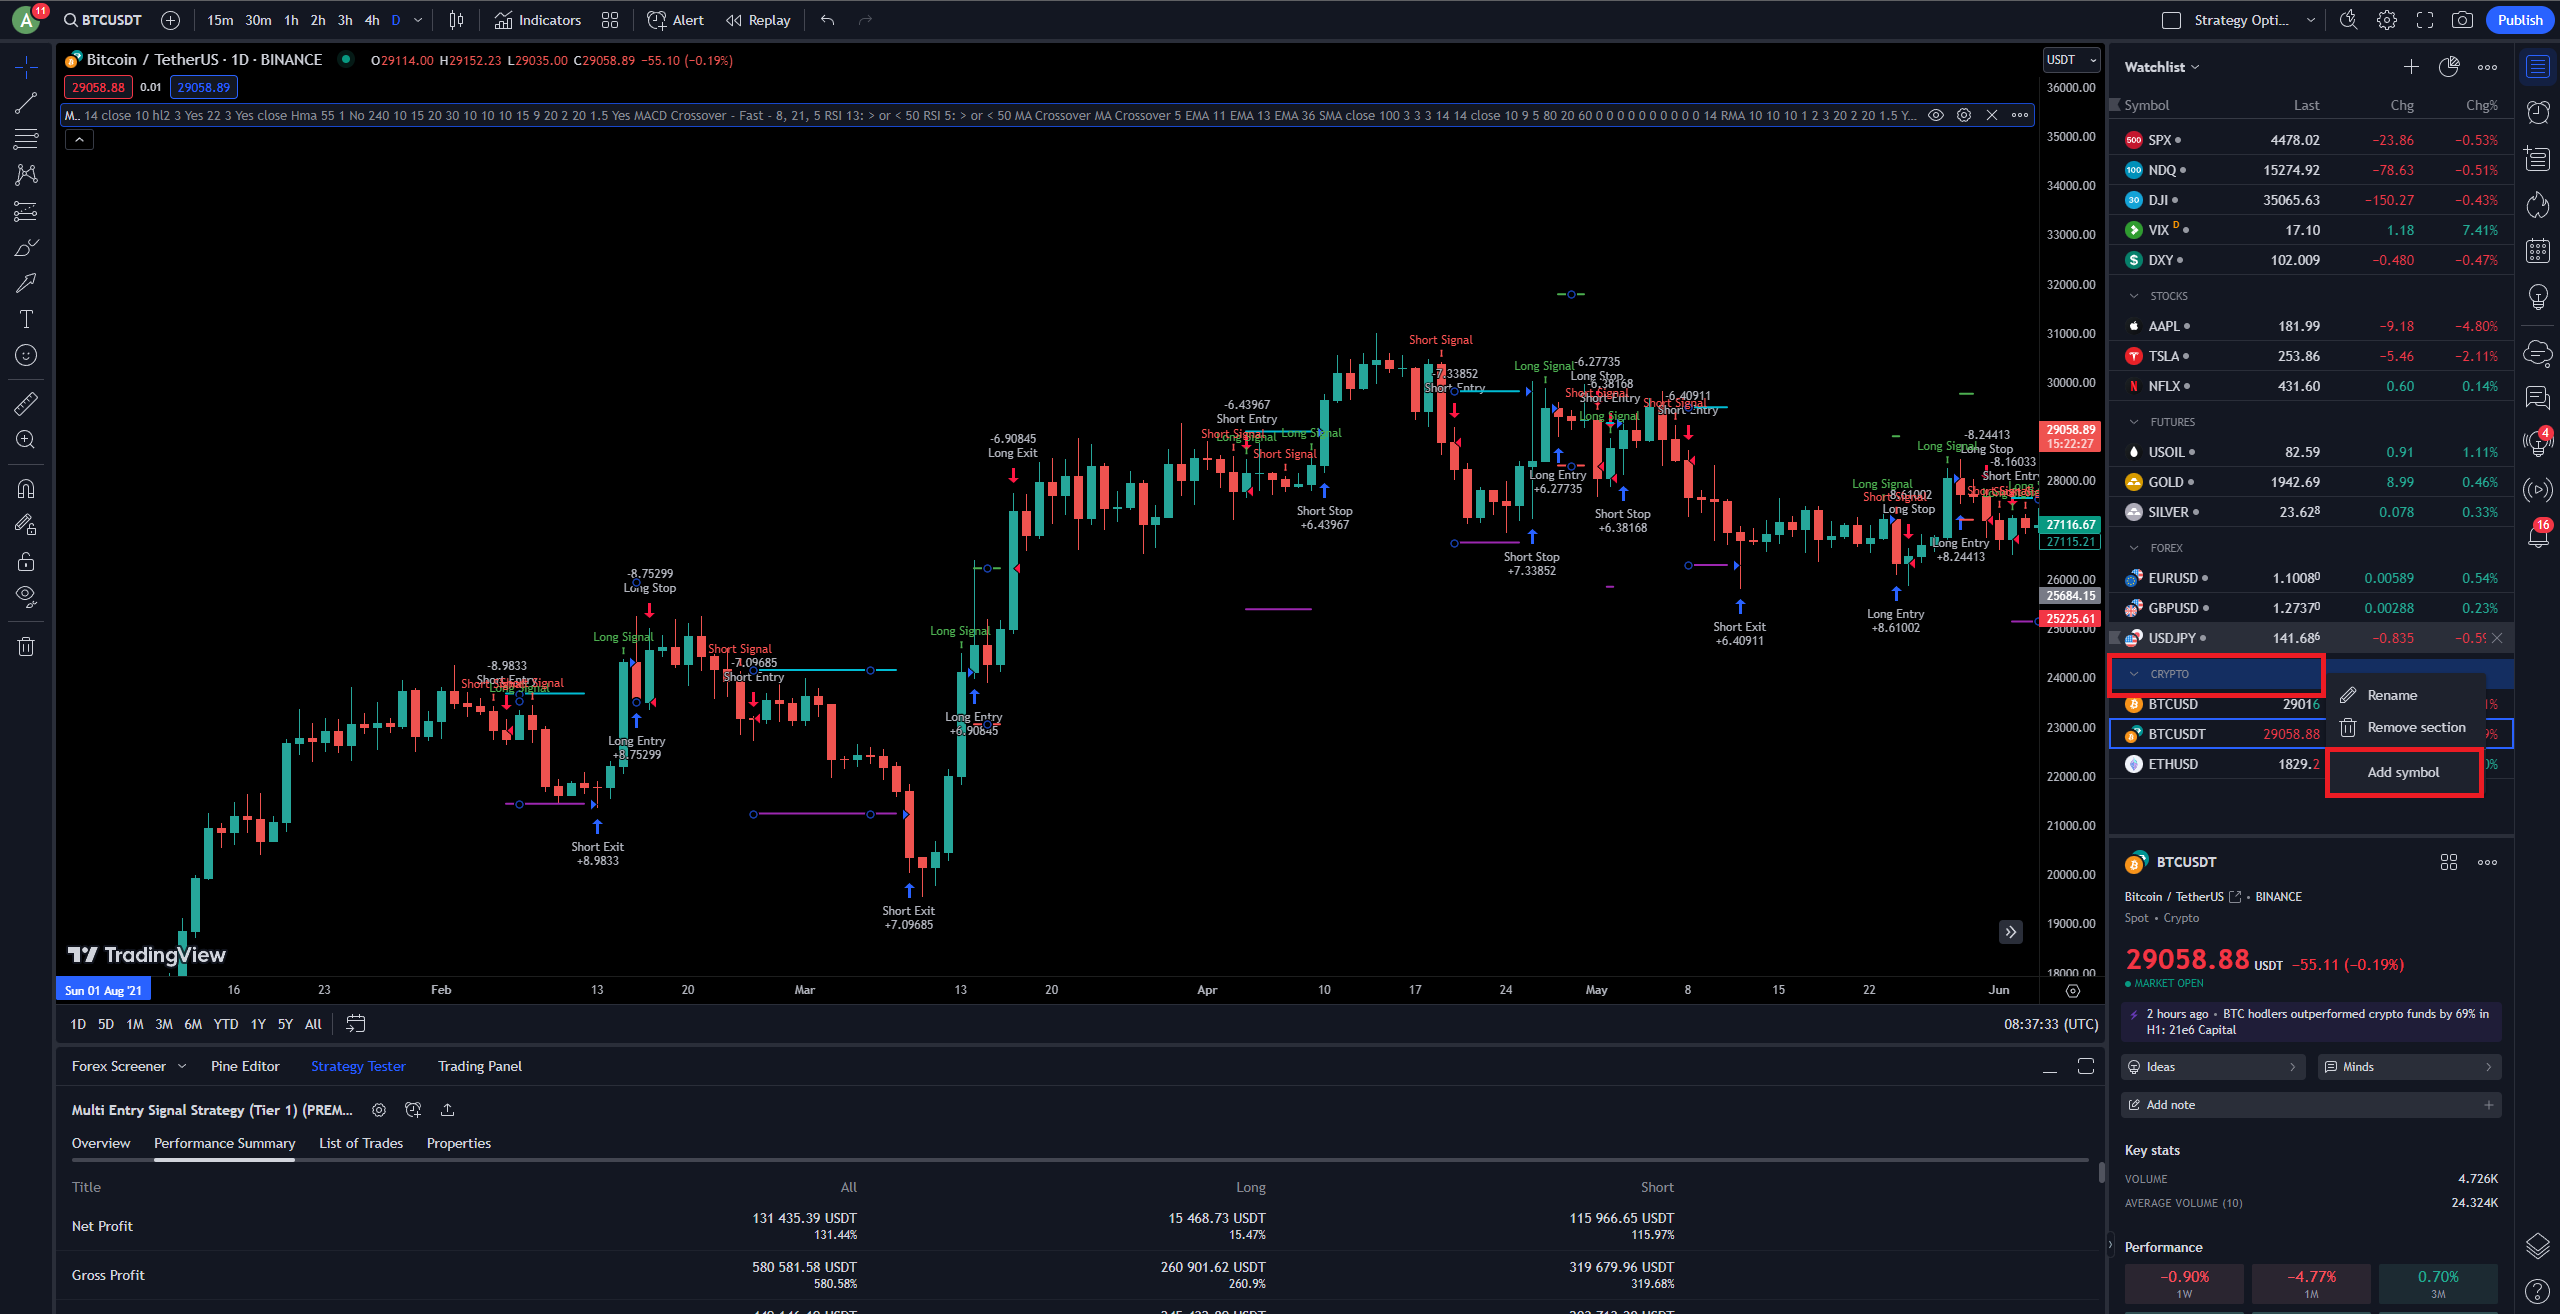
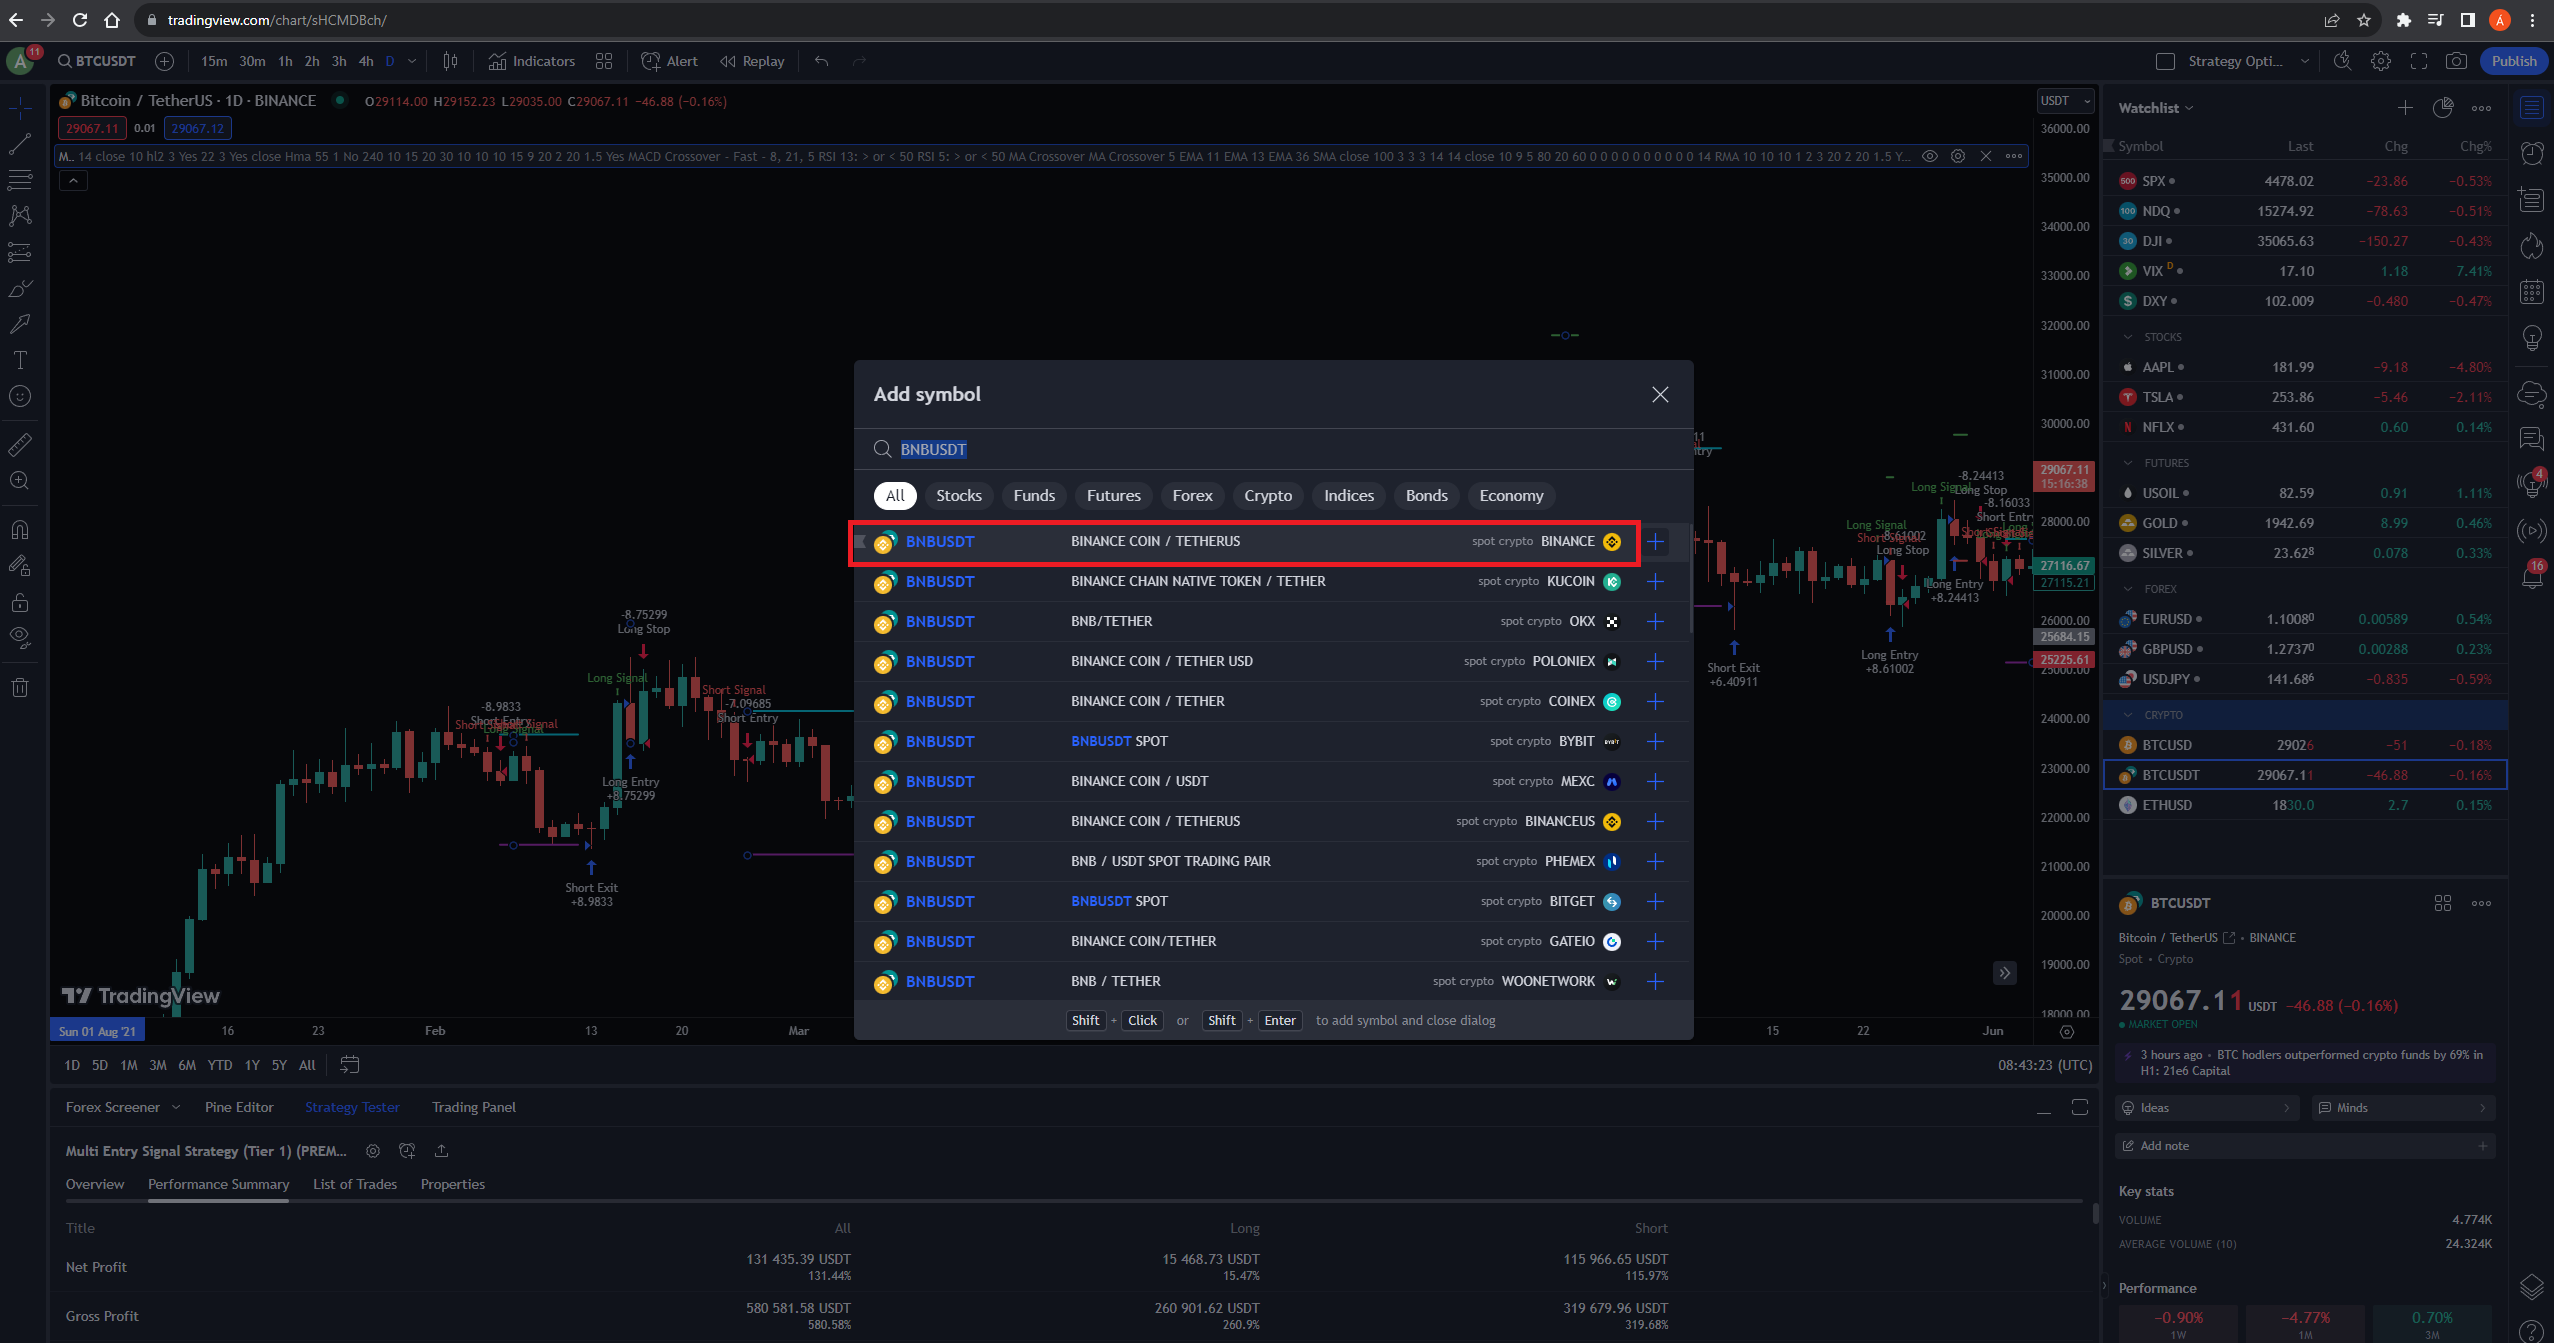
Now you can select the BNBUSDT and BTCUSDT
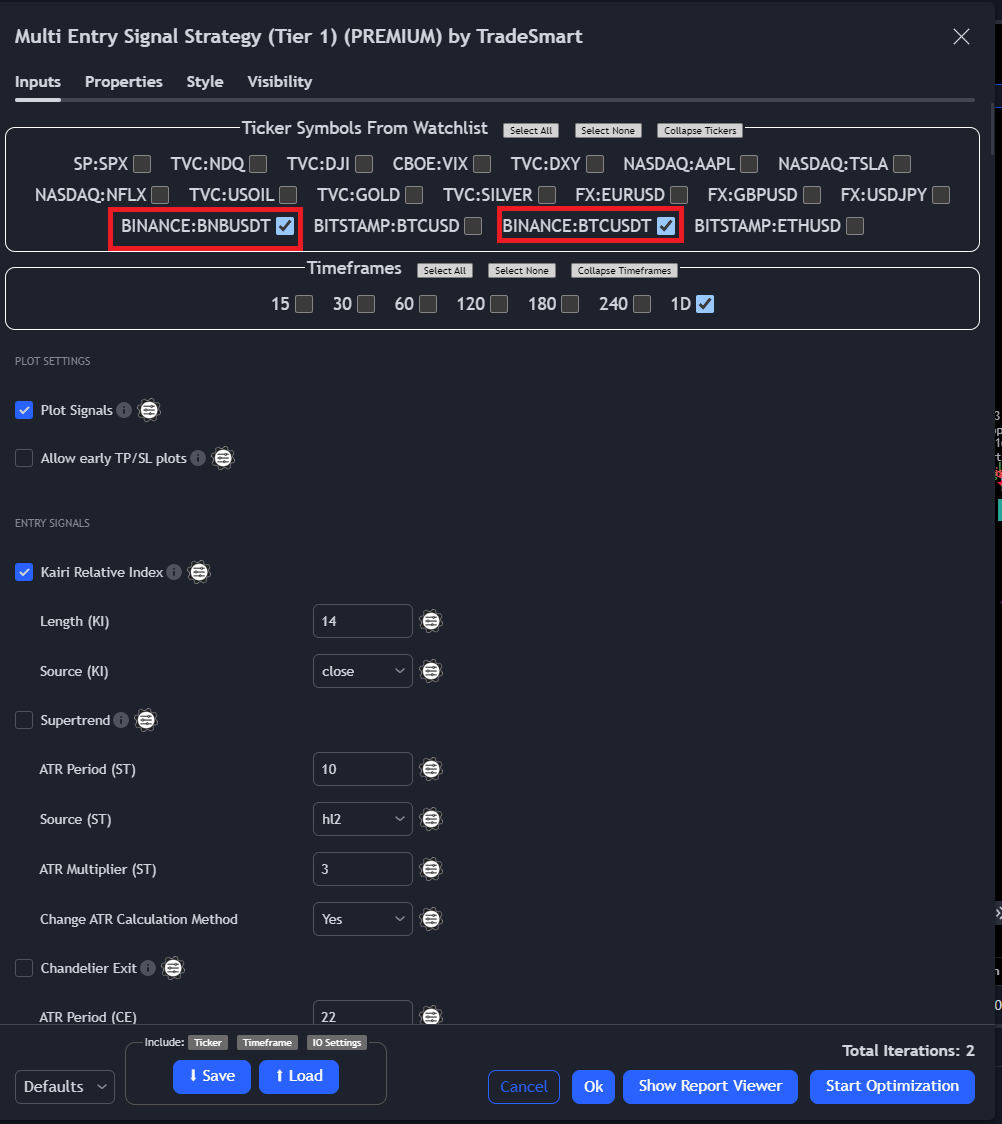
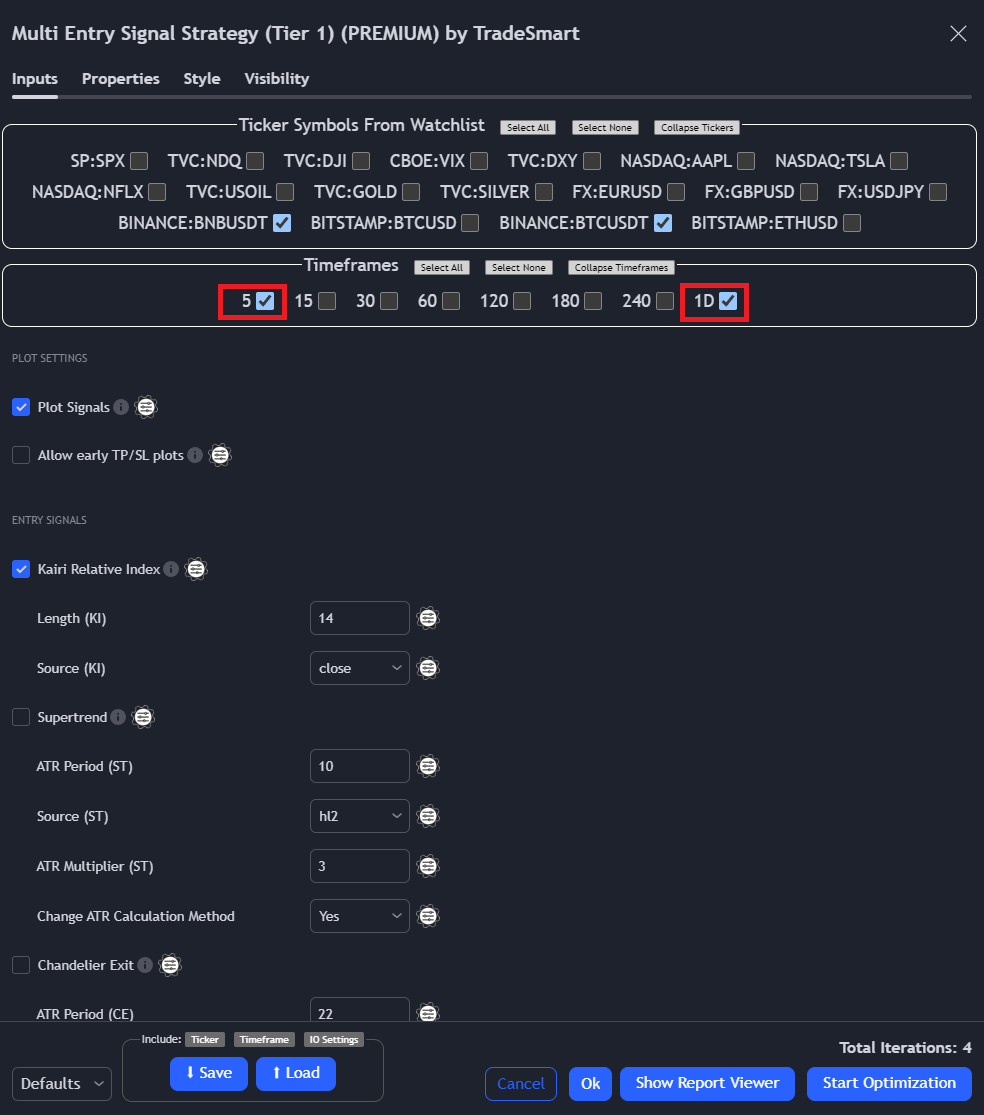
Timeframe
You can add here any Timeframes, if you add them to you favourites.
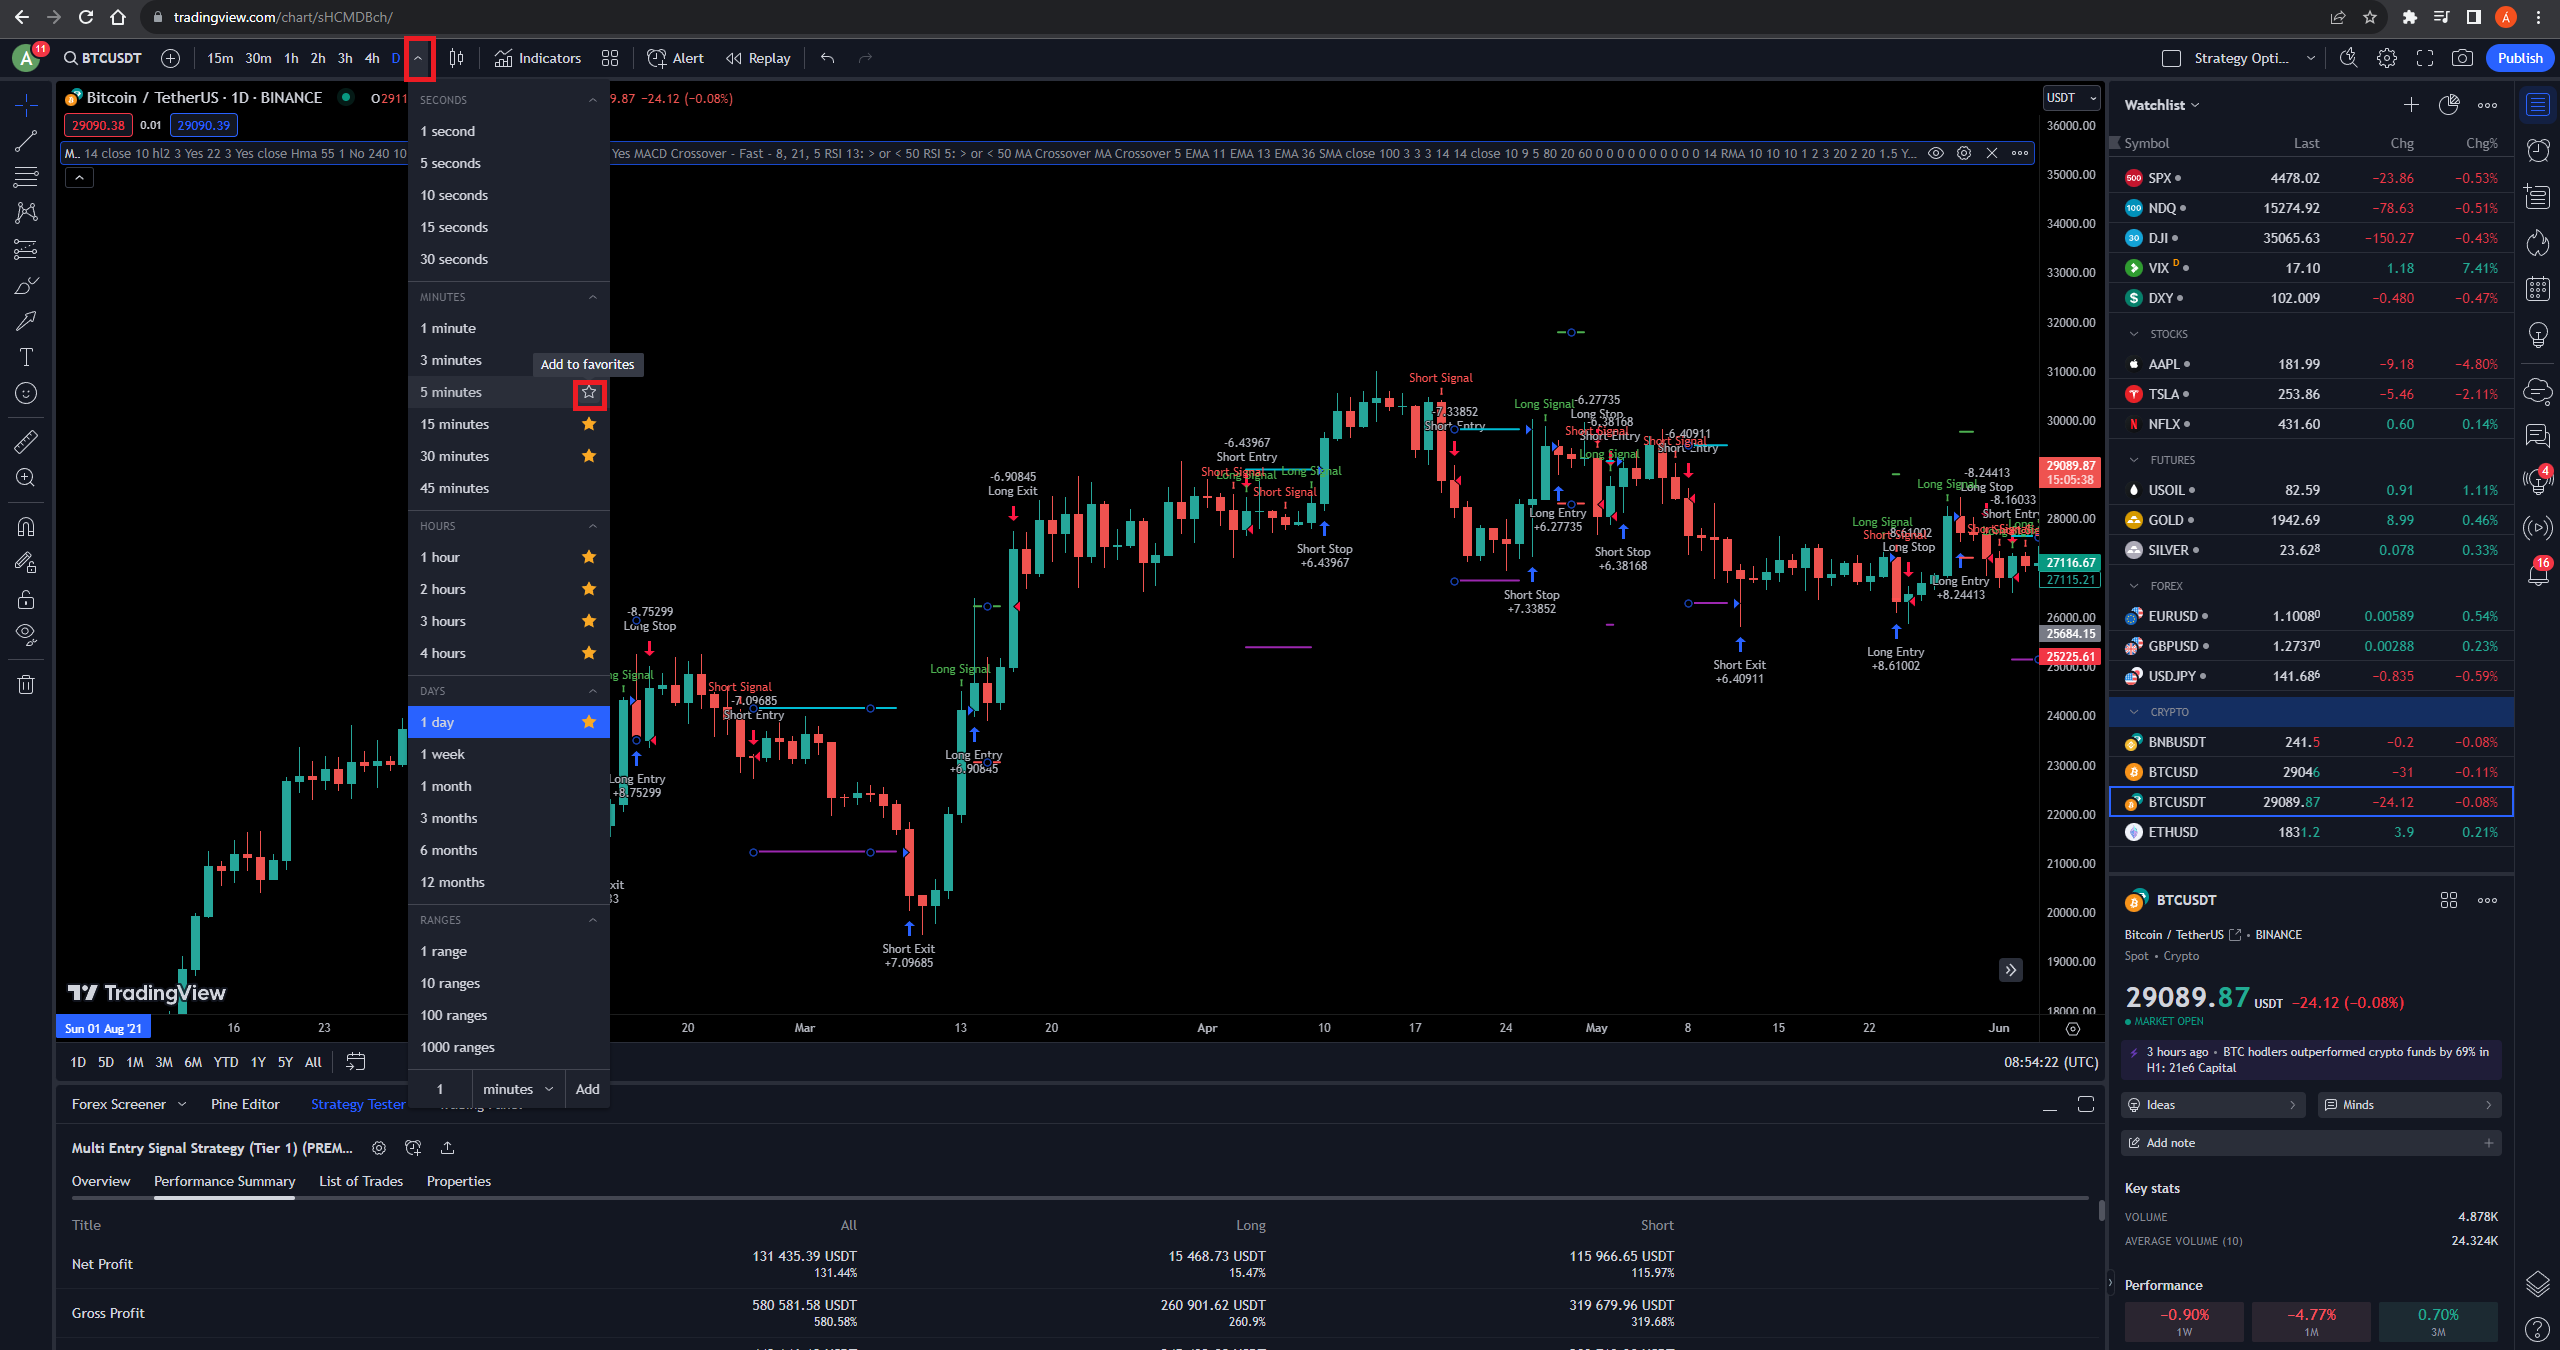
You can now tick 5m and 1D timeframes.
How to optimize Input Values
Let’s say that I would like to optimize Kairi Relative Index
Checkbox
If you click the small symbol next to the checkbox to optimize it you will see a +2 text next to it, this means that it added 2 test cases, the 2 cases are “checked” and “unchecked”.
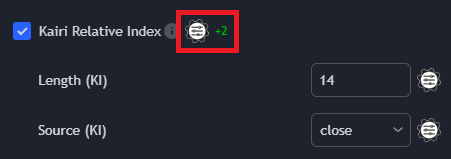
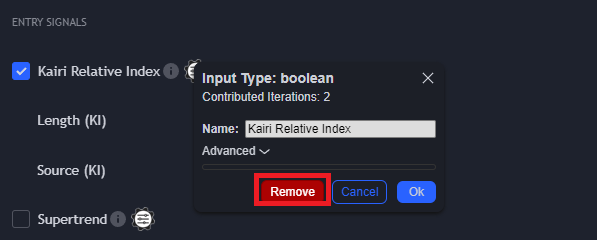
You can remove it from the optimization by clicking it again and then clicking “Remove”.
Text/Number fields
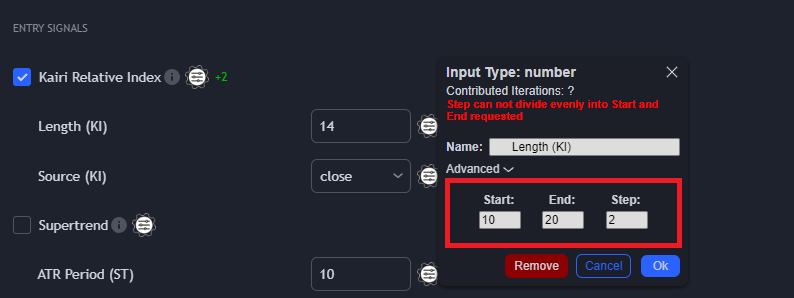
You can also optimize text input fields, by clicking the same icon next to it.
Here you will see 3 values you can add: “Start”, “End”, “Step”
In this case my values are:
- Start = 10
- End = 20
- Step = 2
So the tested cases will be 10, 12, 14, 16, 18, 20
Dropdown Menus
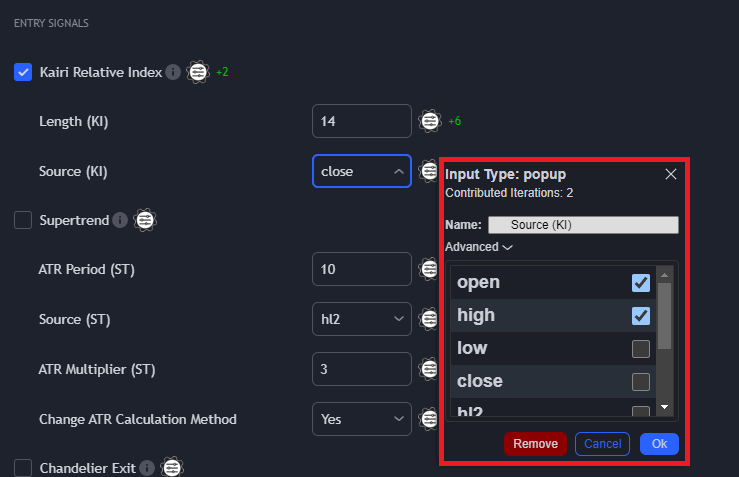
In case of Dropdown Menus you can select the desired options you would like to test, in this case “open” and “high” will be the tested.
Start Optimization
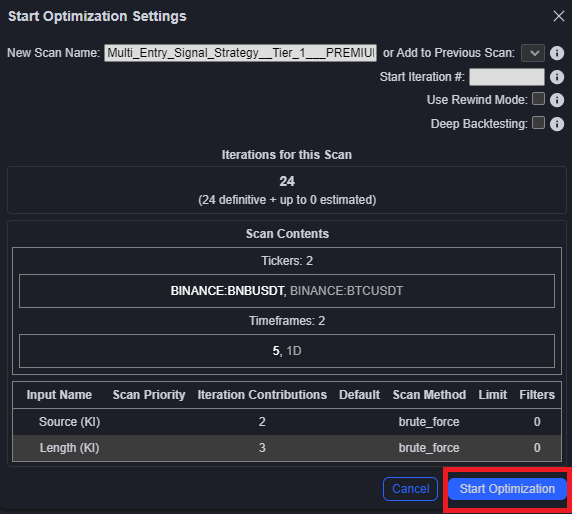
When you are ready setting the values you would like to test, you can click “Start Optimization”.
Safety warning
The free version of the tool only lets you optimize a maximum of 100 iterations.
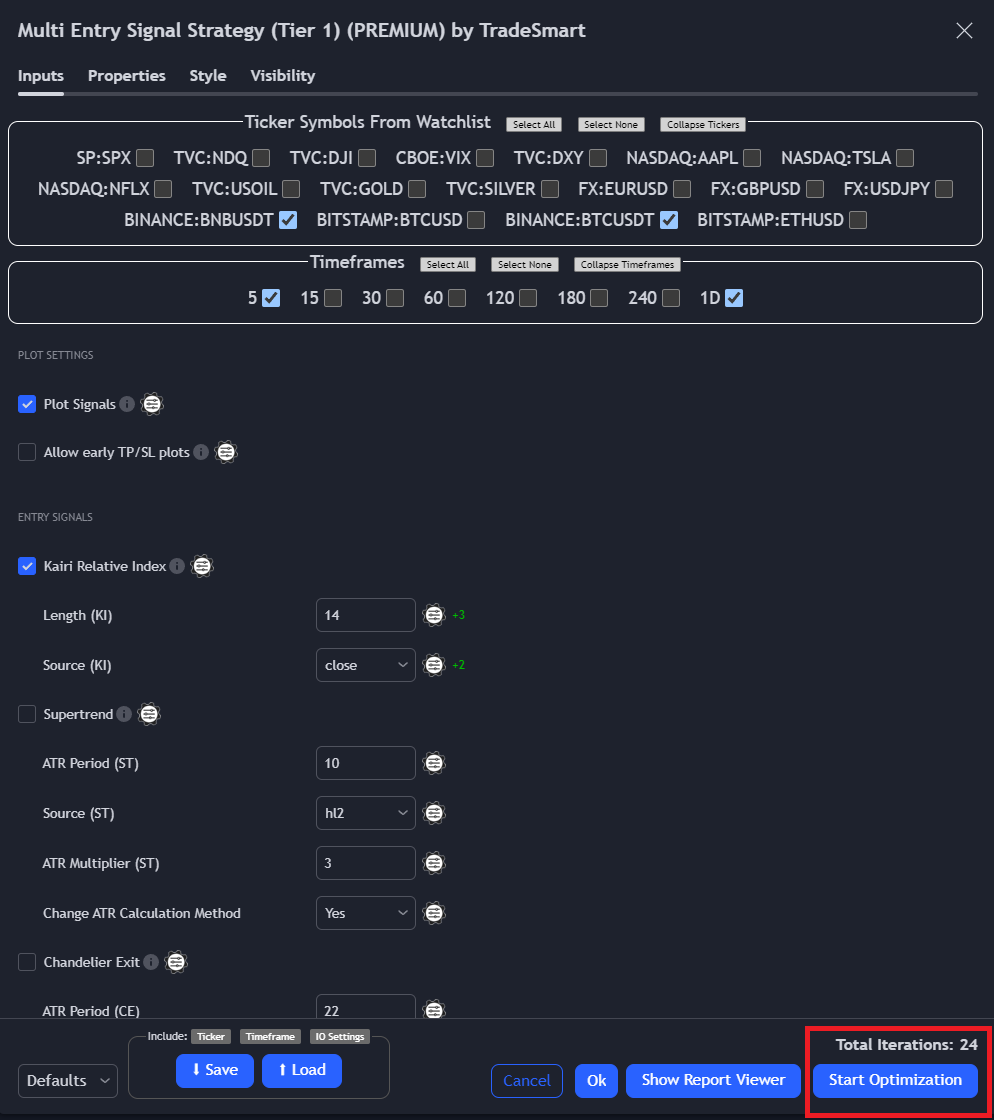
Here you will see a summary of the Optmiziation, you can click “Start Optimization”.
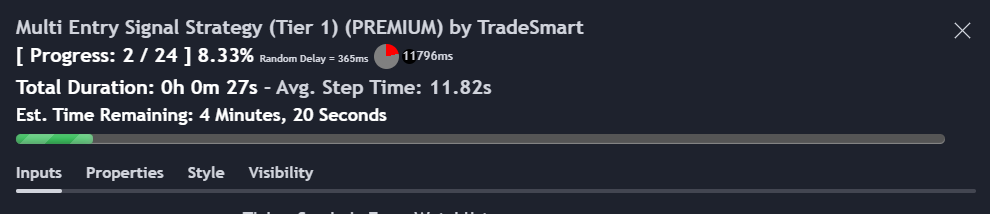
On the top you will see the Optimization progress and estimated time to finish.
Safety warning
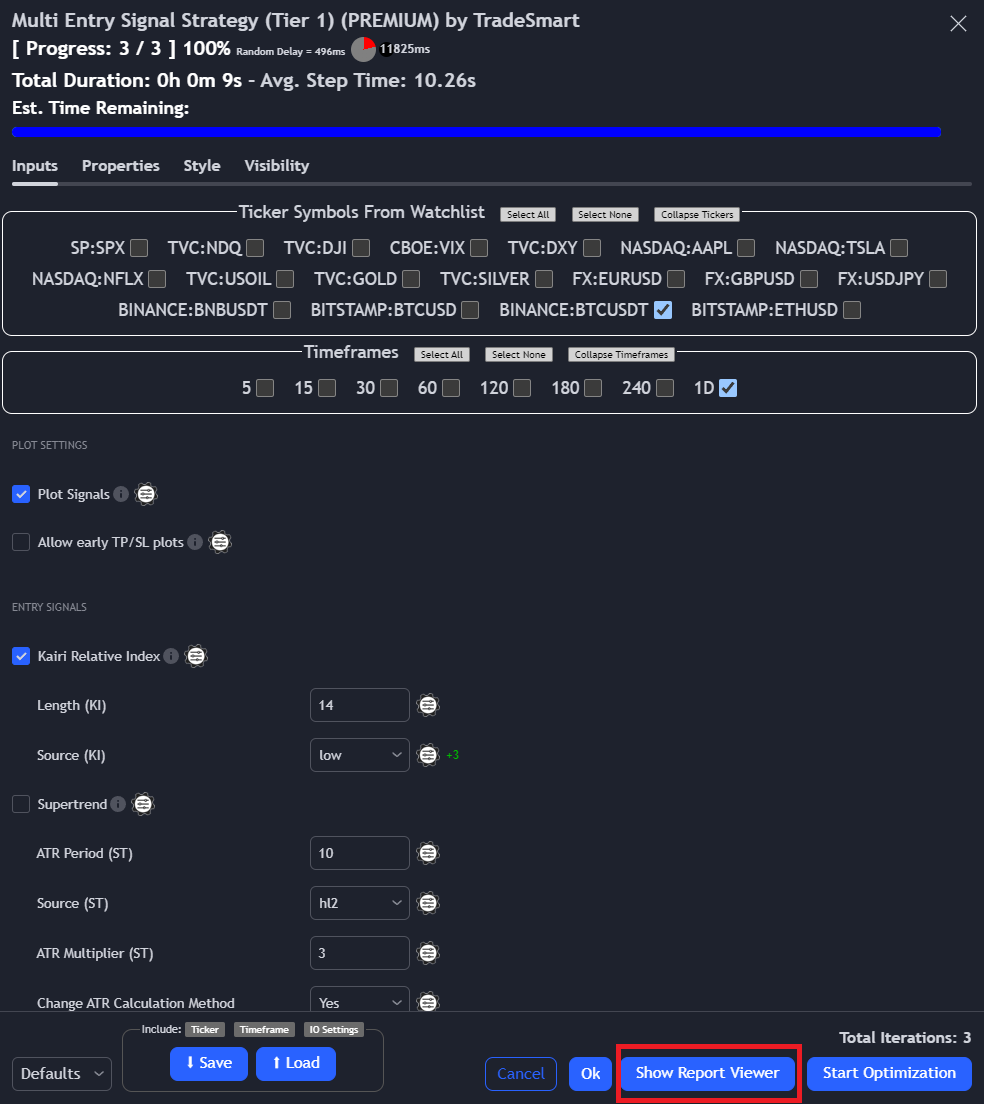
Be sure not to close the window while optimizing!
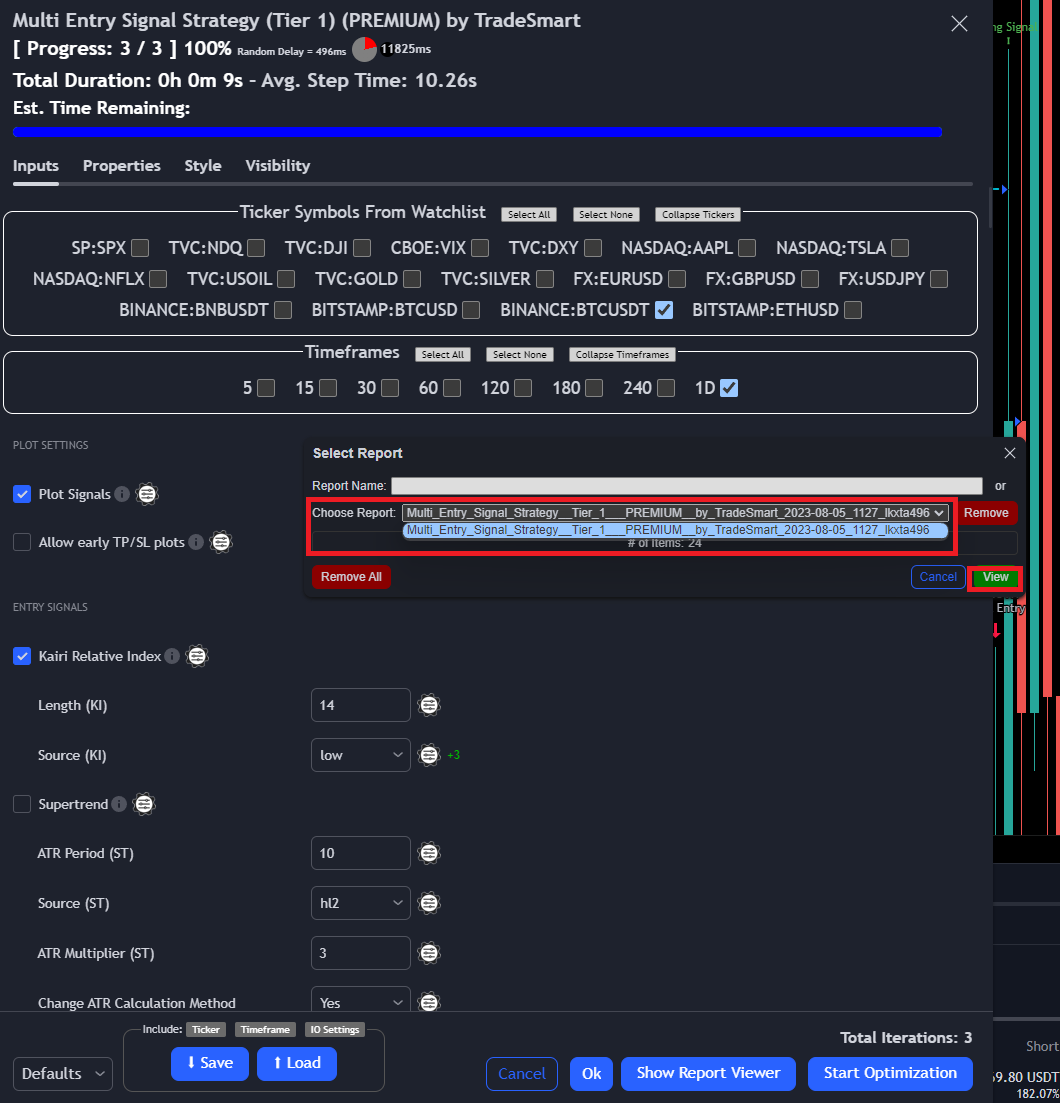
Once it finished click “Show Report Viewer”.
Here from the dropdown Menu select which optimization’s results you would like to check (right now I only have one), and click “View”.
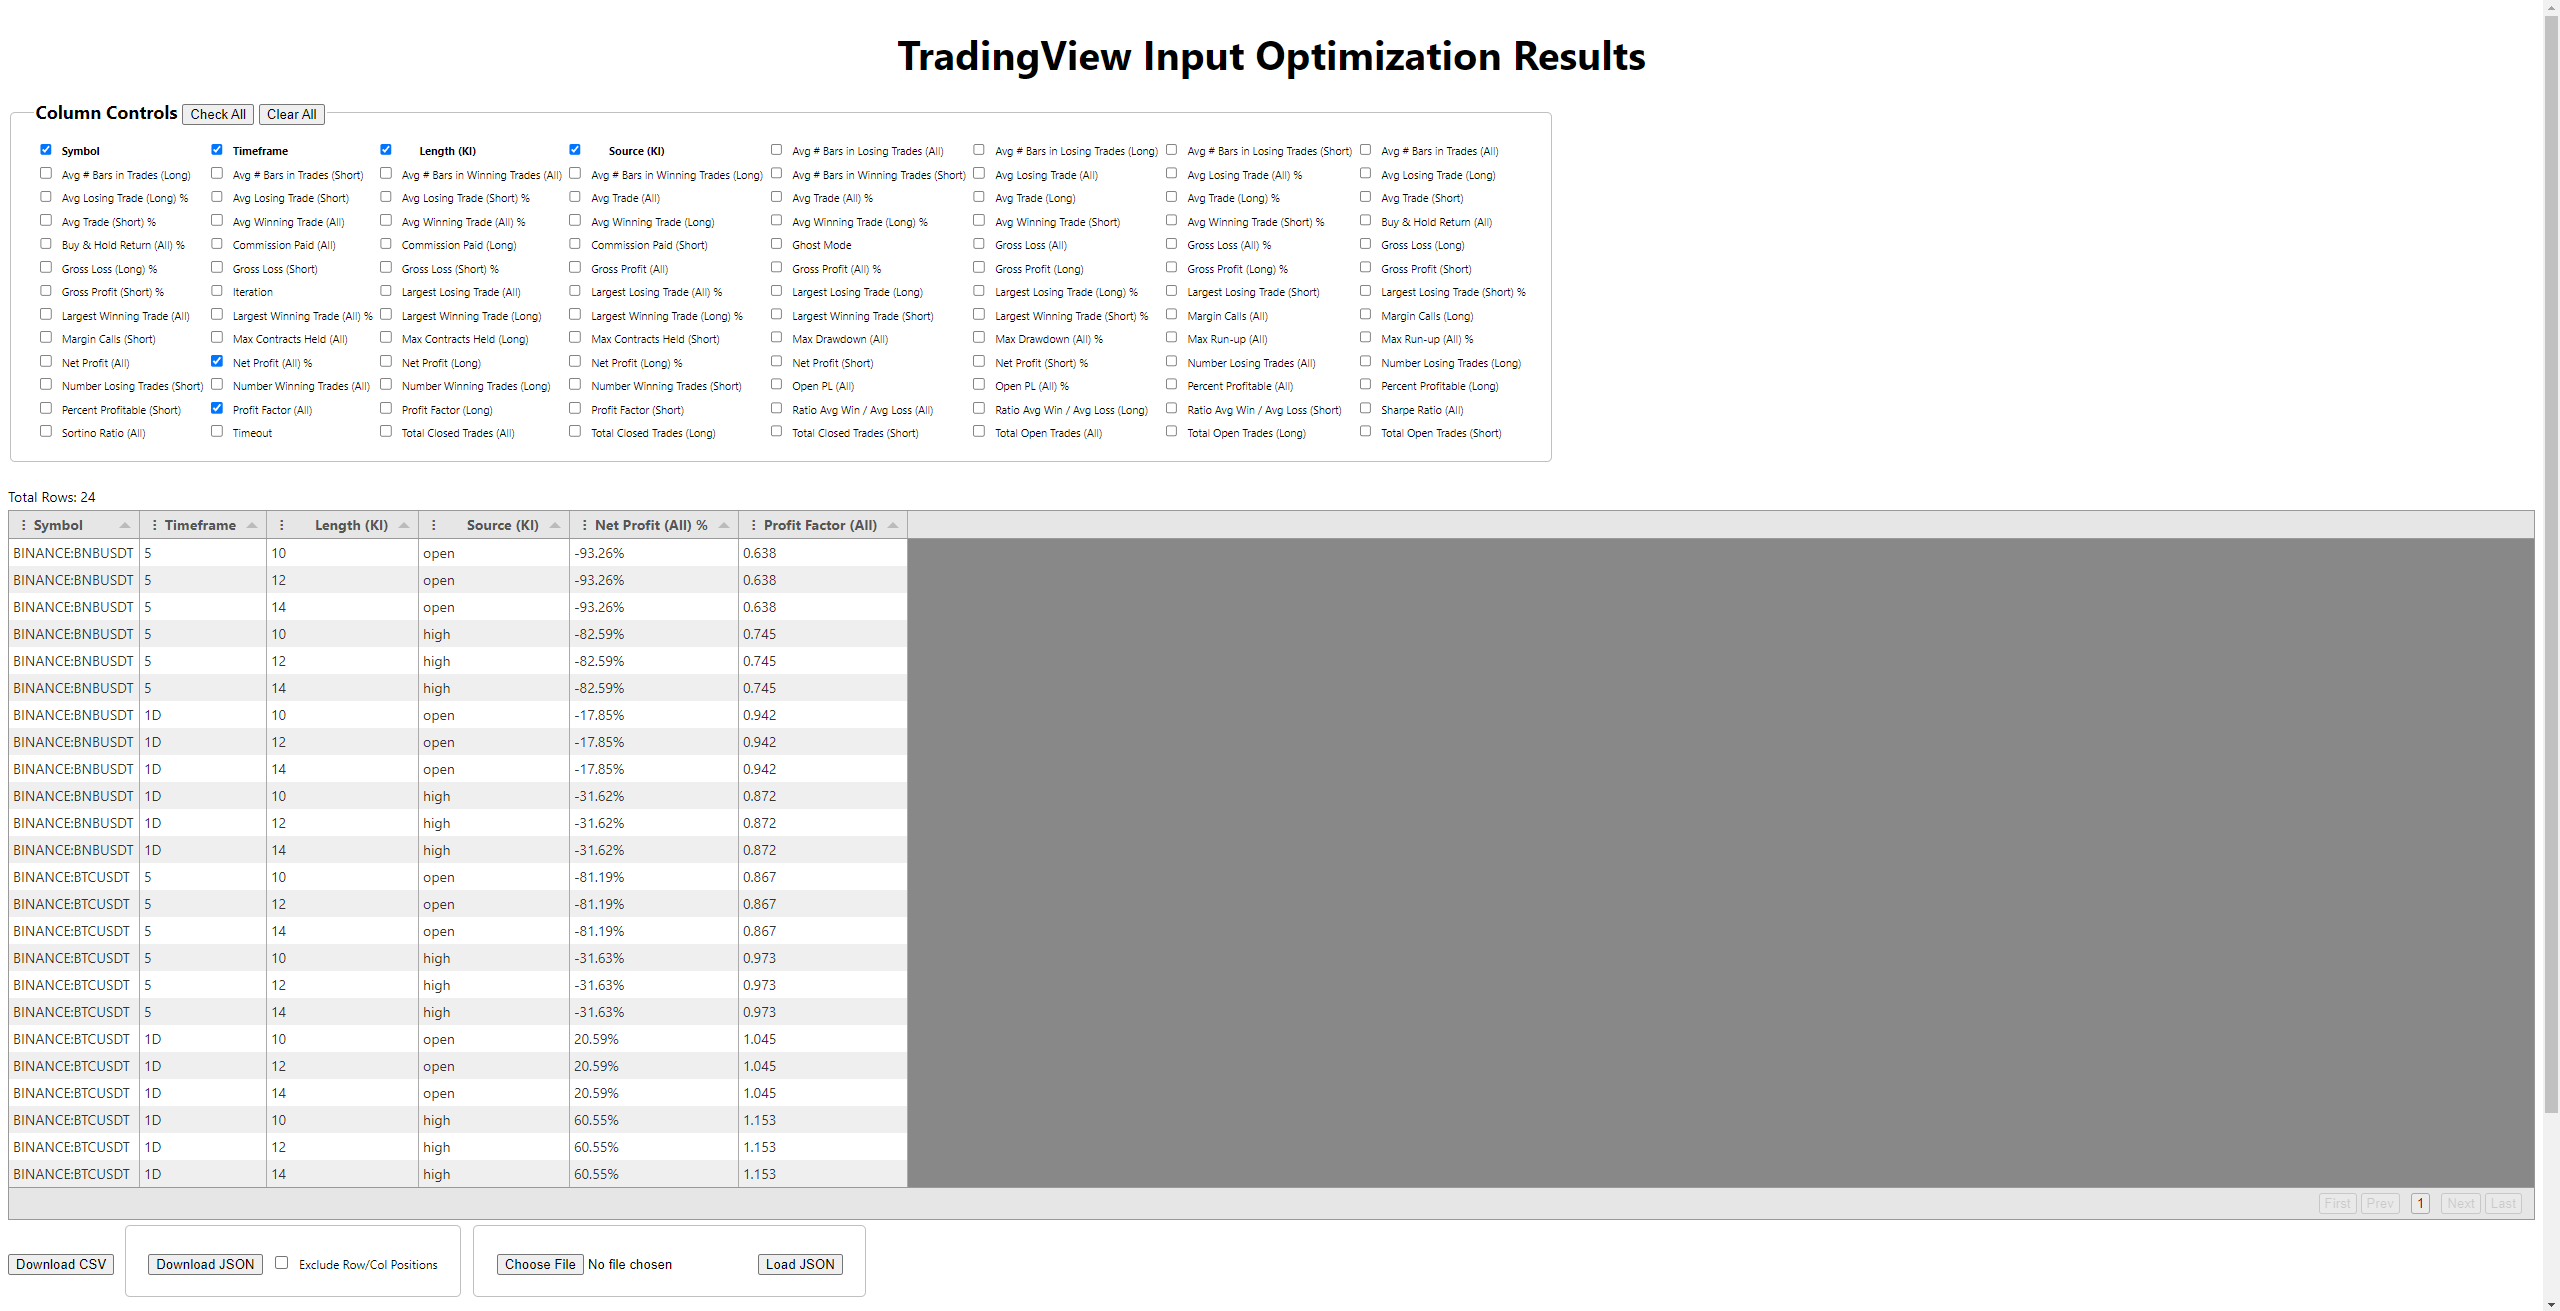
You should see the following screen:
Tip
By default all the columns are checked, here I selected a few of them.
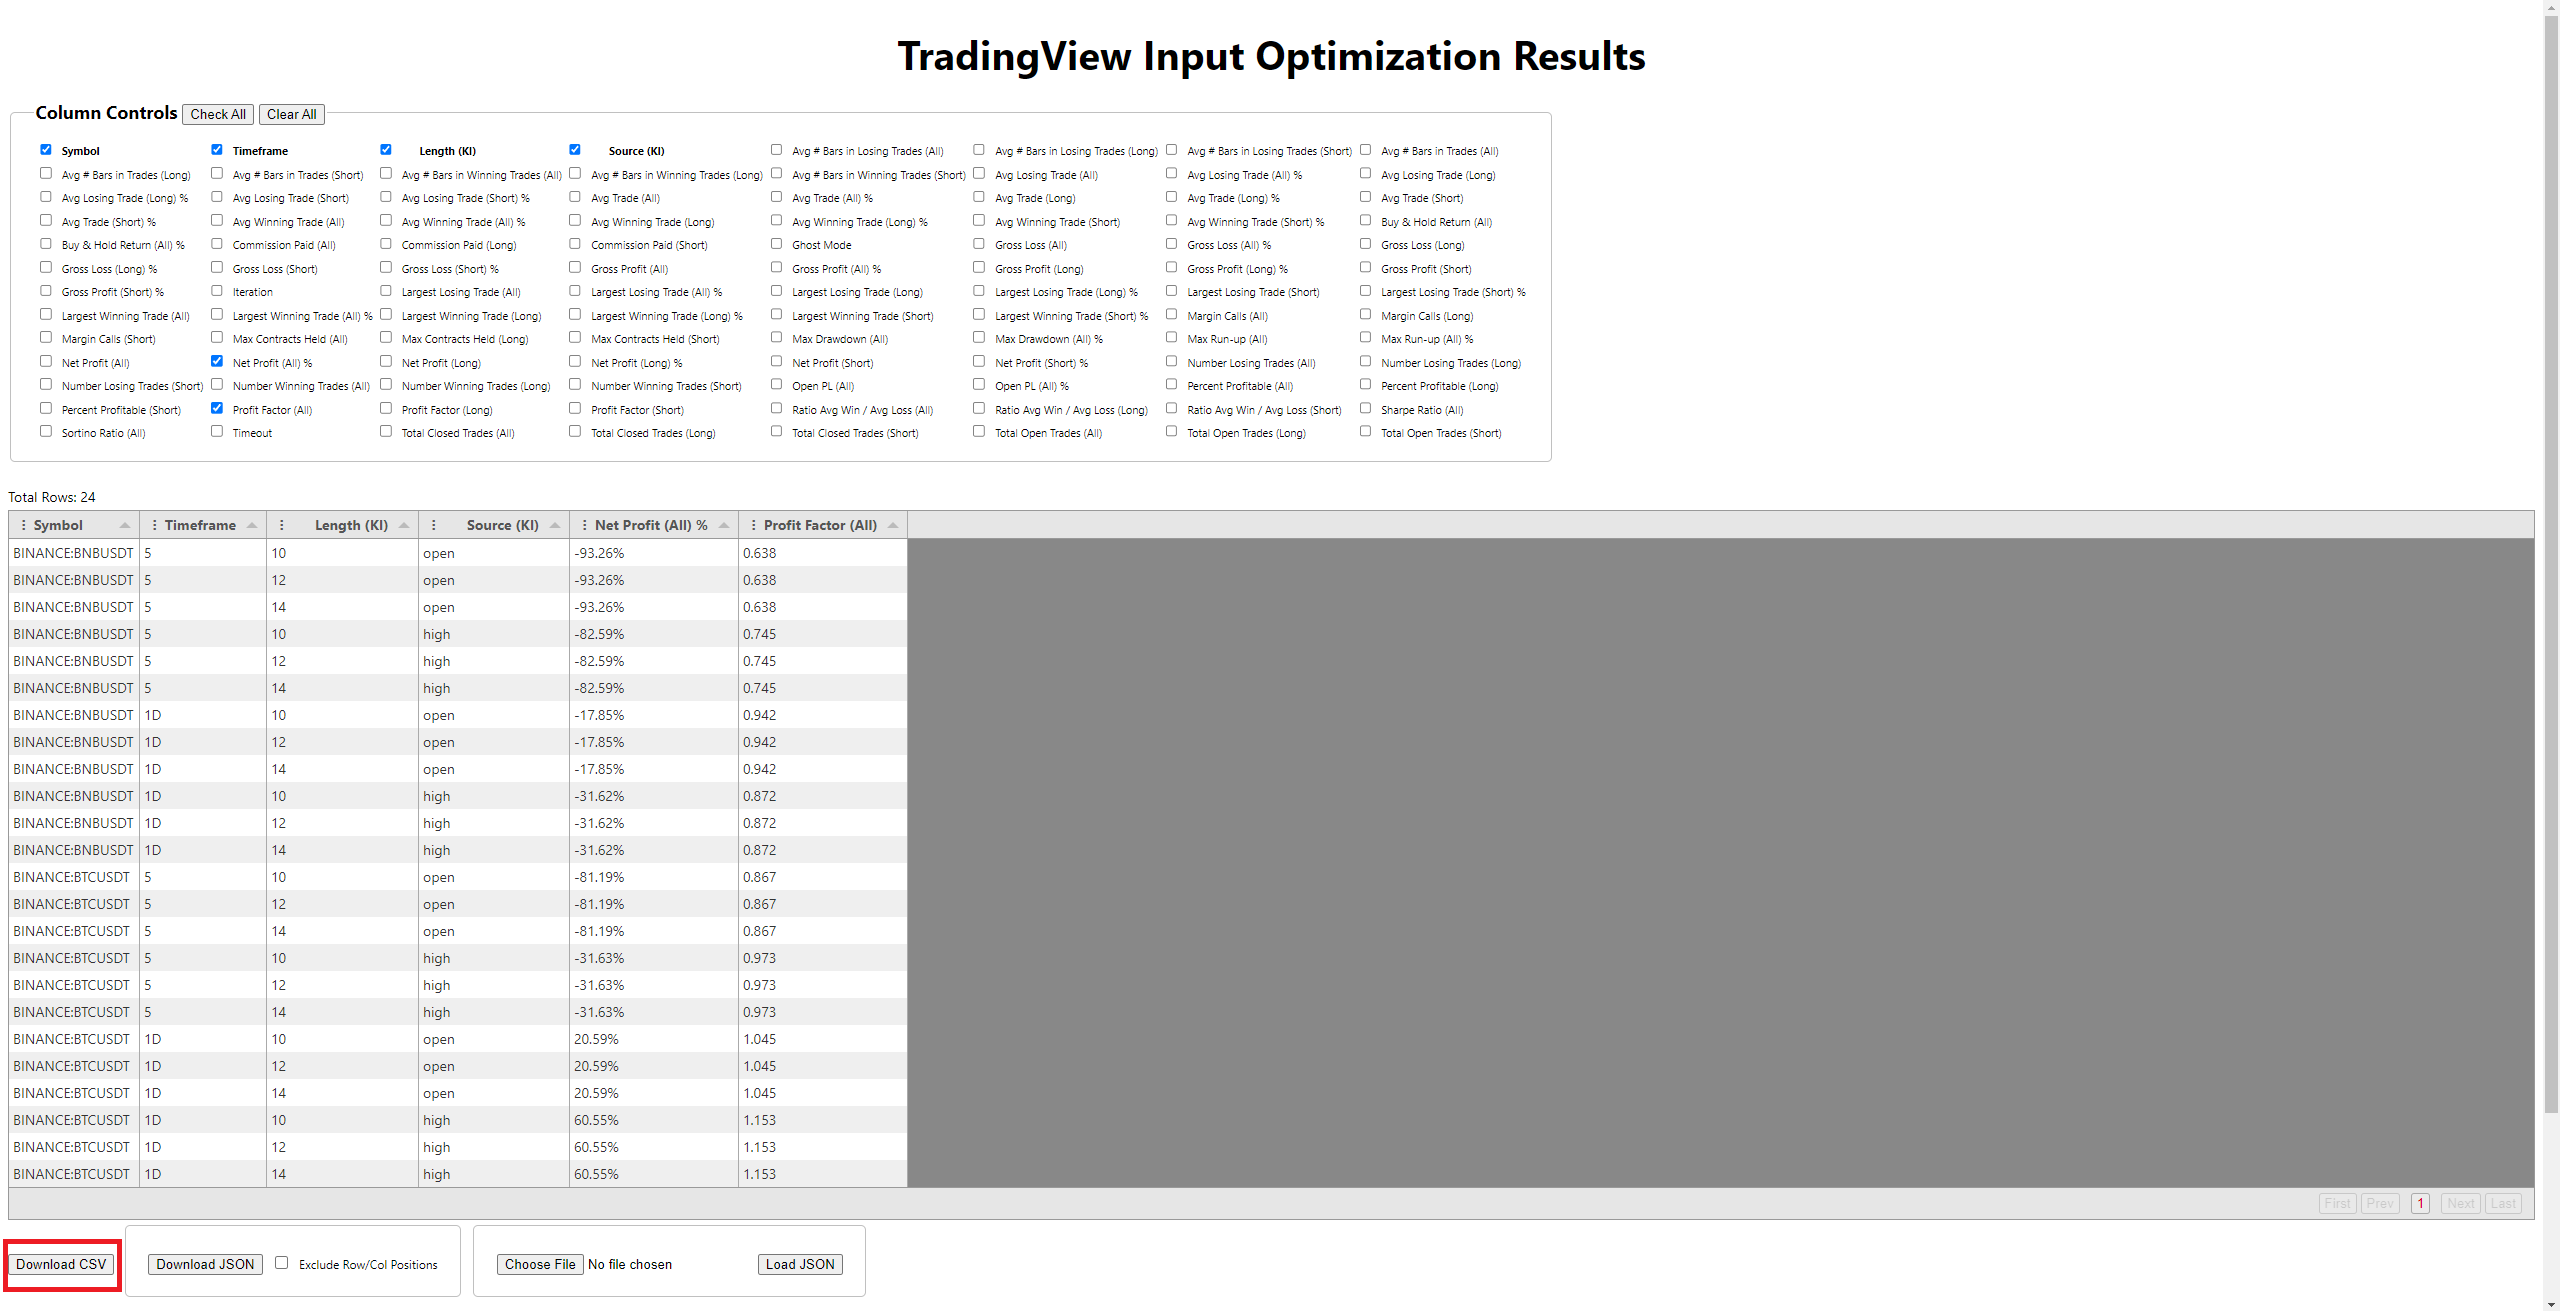
You can also Download this chart in CSV format.
Tip
You do not have to worry about losing data, because the extension saves it even if you close the window.
Congratulations, you have optimized one of our scripts!