
Momentum first
Range Filter and Waddah Attar prioritize directional expansion over quiet price action.
TRADESMART / SOURCE CODE #0052
A selective Nasdaq momentum strategy combining Range Filter and Waddah Attar with RSI, ADX and volume confirmation. Defined protective stops and targets manage risk.
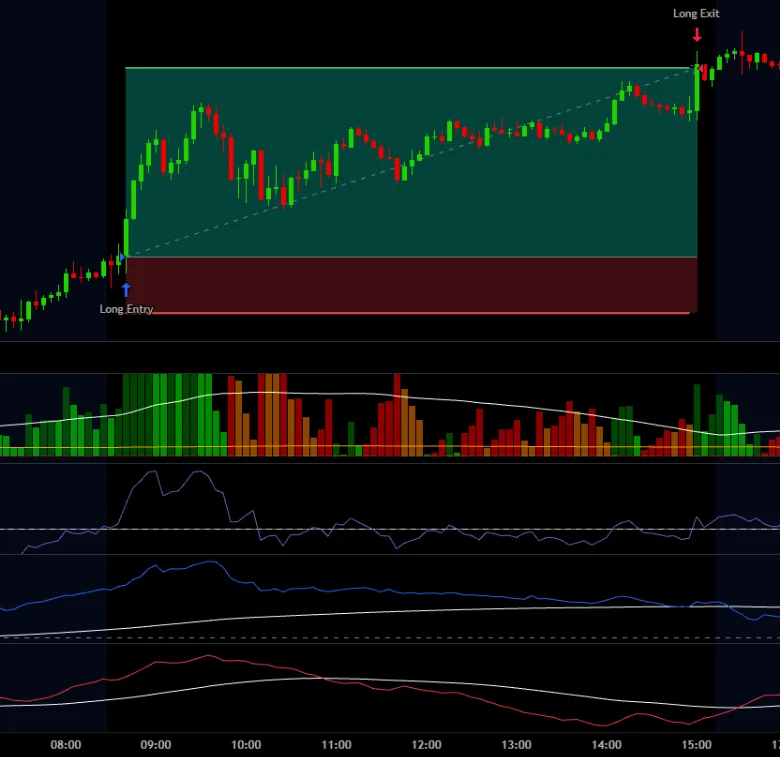
 MOMENTUM QUALIFICATION / DEFINED EXITSSee all trade examples ↗
More than two years beyond the October 2024 release. The current export contains historical trades that closed after the original optimization release date. These are post-release historical replay results, not audited live forward trading.
Range Filter and Waddah Attar prioritize directional expansion over quiet price action.
RSI, ADX, Chande, volume and session gates add entry confirmation.
The historical replay includes two years after the 2024 release; sizing was later revised.
The Nasdaq source version was updated after its original release, including position sizing. The current historical replay is not evidence that an unchanged configuration traded live since 2024. No benchmark outperformance is claimed without a matched buy-and-hold comparison adjusted for market, exposure and costs.
From the supplied TradingView closed-trade reports. Compare sizing modes, release periods and the underlying trade history — with costs already included.
Settings from the supplied October 29, 2026 TradingView export. Slippage is a price movement, not necessarily a monetary fee. The equity explorer uses the separately imported November 4 report.
Report commission paid: Loading…. This is the commission portion only; modeled slippage is not included.
At some assets the backtest models execution costs using slippage instead of commission, so those costs do not appear in the commission-paid total. Net profit already includes modeled commissions. When the $10K visual comparison is selected, the displayed commission figure is proportionally scaled for comparison only; neither it nor the equity is a new $10K TradingView backtest. Total commissions may exceed the final net profit because the former sums fees across all trades while the latter nets gains, losses and costs. See the methodology notes for details.
Combined-view figures match the selected TradingView export's summary where provided. Period-filtered profit factor and drawdown are recomputed from closed-exit data; they are not TradingView intrabar metrics.
Non-compounding fixed-capital risk scenario. Trade-by-trade view uses equal horizontal spacing for every closed exit event; Calendar view reflects the actual event dates. Data exported on November 4, 2026. Reported account equity is initial capital plus cumulative realized net P&L. Closed-exit snapshots cannot reproduce the intrabar drawdown. Separate compounding/non-compounding modes are independent TradingView backtests, not a simple equity multiplier. Period selections only show trades exited inside those dates, re-based to the starting capital of the report.
Historical TradingView replay; net results include modeled commissions. The shown $10K comparison is a visualization normalized from a $100K original report, not a $10K trading simulation. The original backtest initial capital is $100,000 for each export. In some reports, charges on an open trade can make the official summary Net Profit differ slightly from the last closed-exit equity point. Commission paid is reported separately in the source file, while the TradingView Net Profit and cumulative net equity already include that cost. At some assets, additional modeled execution cost is captured through slippage rather than commission, so the commission figure alone is not the full cost picture. Total commission paid can exceed final net profit because it reflects cumulative turnover, not the final balance outcome. The $10K comparable chart applies a 0.1 visual scale to account equity changes and, for easier comparison, proportionally scales the displayed commission amount; it does not rerun trades, alter commissions, respect contract minimums or establish achievable $10K returns. Historical hypothetical returns are not independently audited live results and may differ materially from future execution. See the original optimization research →
Focus on stronger Nasdaq momentum, not every fluctuation. Here's the trading logic at a glance — not the proprietary optimized parameter values.
Range Filter identifies directional Nasdaq conditions
Waddah Attar, ADX, RSI and volume filters qualify strength
Intraday session controls help screen marginal setups
Protective stop and predefined take-profit manage risk
Real examples supplied with this strategy. These are historical examples, not a promise of typical future trades.
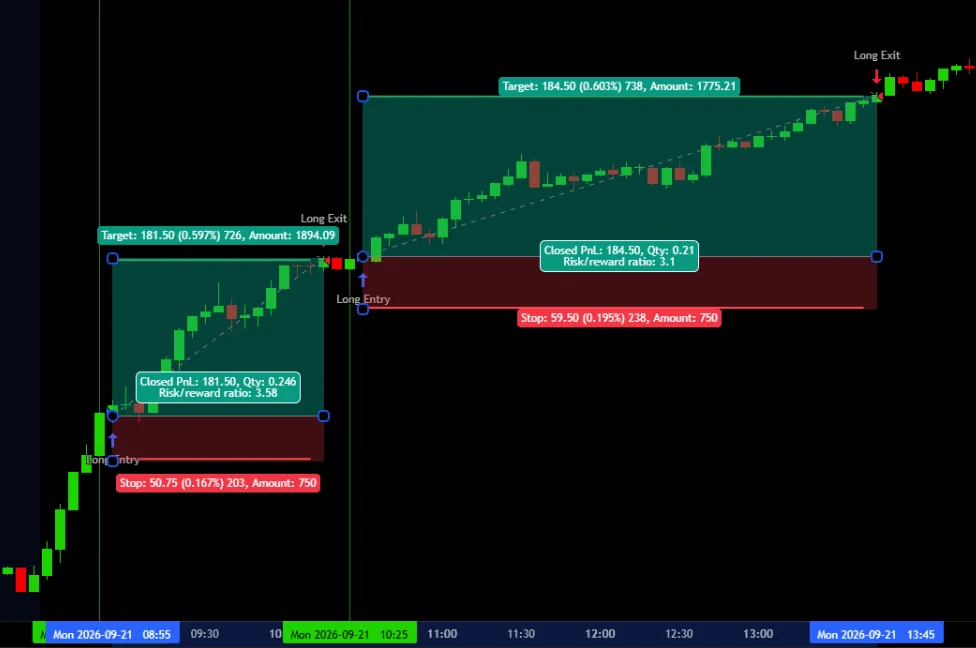
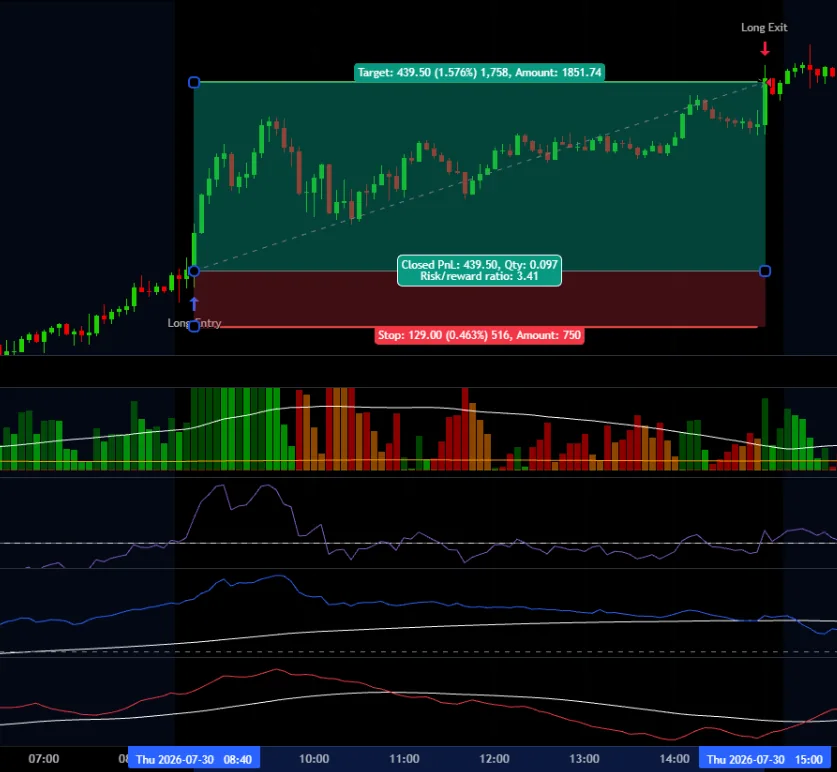
Click a trade screenshot to enlarge. These are actual historical chart examples, not a representative average trade.
You receive the full editable optimization-specific variation of our Premium Strategy, with every feature needed for this particular optimization and its optimized defaults. This is not the unmodified general-purpose Premium script with every optional feature. Smart Trader membership provides invite-only access, not source-code ownership.
Review the historical chart examples, inspect the interactive equity explorer, then compare the product scope and licensing below. This section intentionally stays lightweight until a dedicated walkthrough video exists.
The complete optimization-specific Pine Script source and setup documentation for Optimization #0052. Designed for traders who want to inspect, customize or personally automate their own edition.
Yes. You receive the complete editable source code variation modified for this optimization, containing the features required by its optimized defaults, plus usage and automation guides. It is not the unmodified general-purpose Premium Script with all optional features. TradingView alerts can connect to supported brokers and third-party execution services, but setup and independent testing are required.
The supplied strategy is designed not to repaint confirmed historical entries. Live execution and intrabar behavior still depend on your TradingView alert configuration and broker fills.
Adding a Pine strategy to TradingView is straightforward. Automated execution involves additional alert, account and broker configuration; use the included instructions and test with simulated execution first.
No. The source-code purchase is separate from the $29/month Smart Trader membership. Membership includes eligible invite-only strategy access, presets and private Discord, but does not include editable source code.
The one-time purchase is for personal use only. Resale, re-upload and redistribution are not permitted. Dedicated support is not included. Digital product sales are non-refundable except where required by law; always review the final Patreon Shop checkout and applicable terms.
No. All charts show hypothetical TradingView historical backtests rather than independently verified live trading. Results are sensitive to fees, liquidity, slippage, position sizing and future market conditions.